What is the normal distribution?
The normal distribution, also known as the Gaussian normal distribution or bell curve, is an important distribution in statistics and occurs in many different applications. It describes a symmetrical distribution in which the data are distributed around a mean value (the arithmetic mean). The normal distribution has a characteristic course in the form of a bell curve and is defined by two parameters, namely the expected value (mean) and the standard deviation.
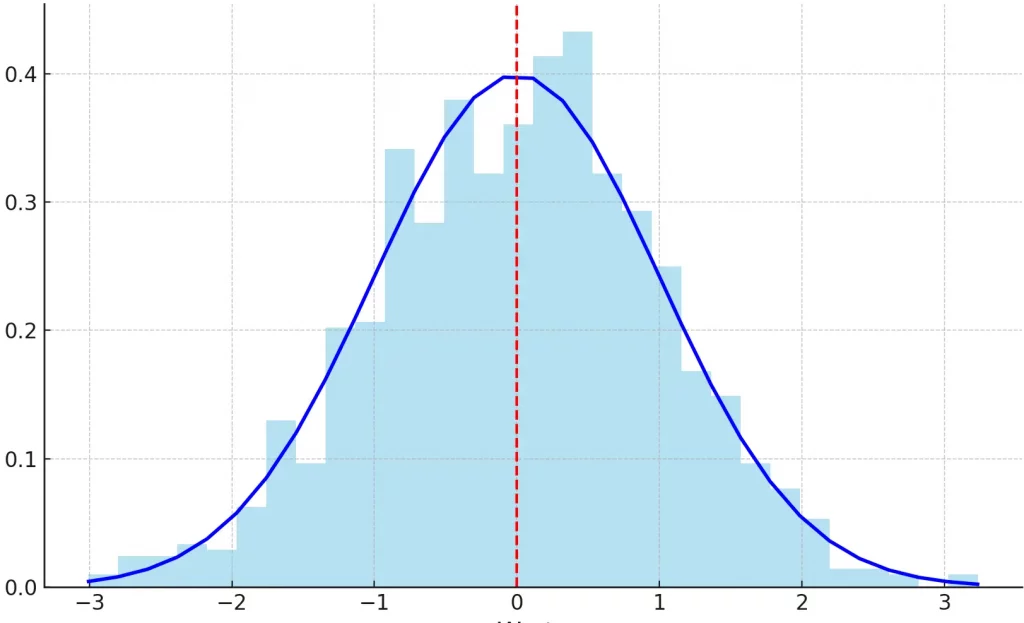
The normal distribution occurs frequently in natural phenomena and is therefore often used as a model for the distribution of data in many fields, such as medicine, psychology, and econometrics. However, there are also many cases where the data are not normally distributed, where other distributions are more appropriate. It is therefore important to check the normal distribution of data before analyzing it.
In many cases, the assumption of a normal distribution is assumed as a prerequisite for the validity of analysis methods. Therefore, it is important to check the normal distribution of data before proceeding with the analysis. In SPSS, there are several ways to check for normal distribution. These include, for example, distribution tests that check for normal distribution, and graphs such as histograms and Q-Q plots that visualize the distribution of the data.
In this post, we will look at the topic of testing for normal distribution in SPSS and present various ways to test for the normal distribution of data in SPSS. We will cover the different testing procedures and graphs and show how to apply and interpret them in SPSS. We will also discuss how to handle non-normally distributed data, if necessary, and what alternatives are available.
How do you test for normal distribution in SPSS?
In SPSS there are several ways to test the normal distribution of data. One way is to use the “Test for Normal Distribution”. This test is found in the “Analysis” menu under “Descriptive Statistics”. When this test is selected, you can choose the data field to examine and SPSS will then produce a series of statistics and graphs that will help examine the normal distribution of the data. In this tutorial, we will go through this process step-by-step. In addition, we will look at charts and plots.
To test the variables for normal distribution, the Shapiro-Wilk test and the Kolmogorov-Smirnov test are suitable statistical test procedures that use a significance value as the decisive result (p-value) criterion. We will use both procedures in this manual.
Where can I find the sample data set of these instructions?
Sample data is here
Test for normal distribution in SPSS
Perform a test for normal distribution in SPSS. Including Shapiro-Wilk test.
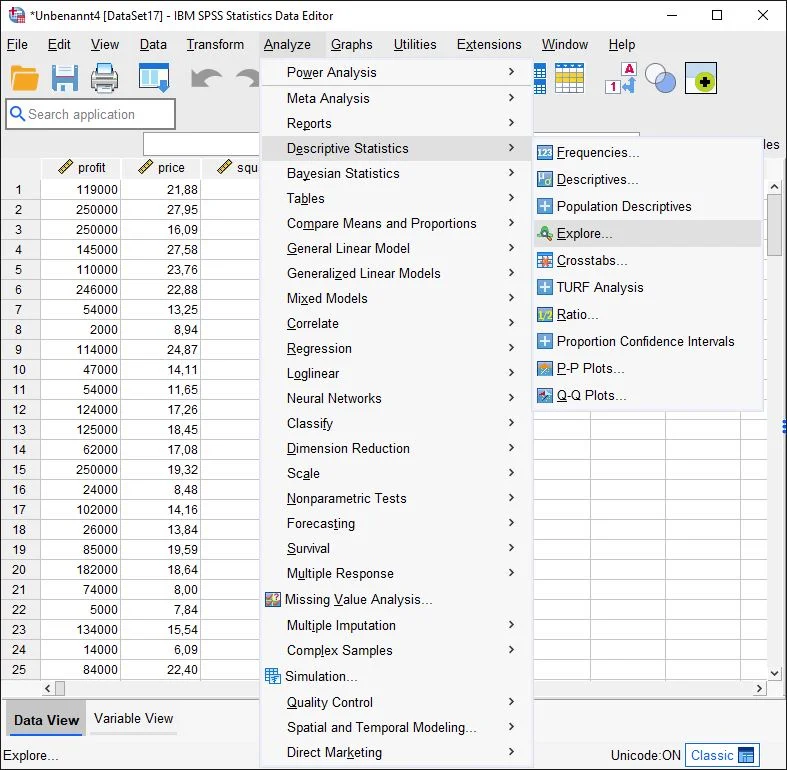
Auswahl im Menü

We click on the Analyze > Descriptive Statistics > Exploratory Data Analysis button in SPSS.
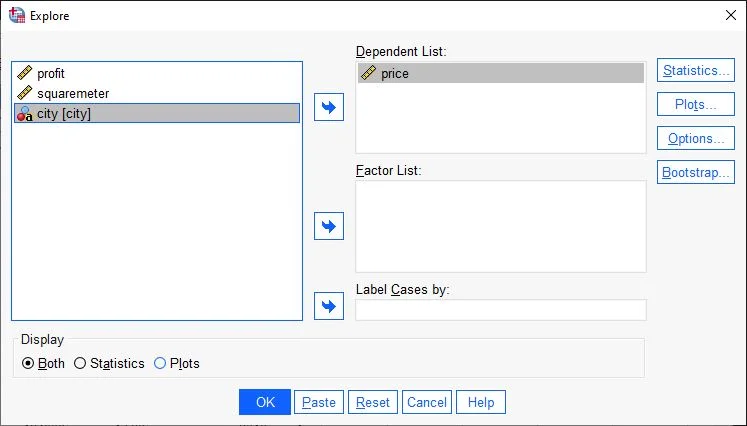
Dialog windows exploratory data analysis in SPSS

The Exploratory Data Analysis dialog box appears. On the left, there are all the variables of the data set.
We drag-and-drop the variable to be examined onto the Dependent variables field. Alternatively, we highlight the variable with a click and then press the arrow key (green arrow) to move the variable to the Dependent Variable field.
Note: If your record contains several different groups, the corresponding group variable can be inserted in this field. For example, the city. This variable is not in the dataset.
Now we click on the Statistics field on the right side of the page
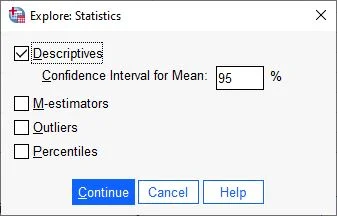
Exploratory Data Analysis Statistics Dialog Box

The Exploratory Data Analysis: Statistics dialog box opens.
Here we check Descriptives and click Next.
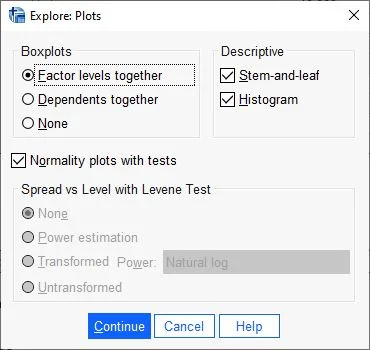
Diagram selection

Now we click on the Plots field on the right side.
Set diagrams

The Diagrams dialog box opens, where we select the Histogram option in the Descriptive Statistics field and check the box “Normality plots with tests“.
“Note: For this tutorial, it’s not necessary to select the ‘stem-and-leaf’ option as depicted in the screenshot. Please disregard that part.
We confirm our entries by clicking Next.
Ready to start analysis for normal distribution in SPSS

Finally, click OK to confirm and look at the output in the next step.
Interpretation of the outputs in SPSS
SPSS shows us many tables at this point. First, the Descriptives table shows us an overview of key figures. Here we are interested in skewness and kurtosis.
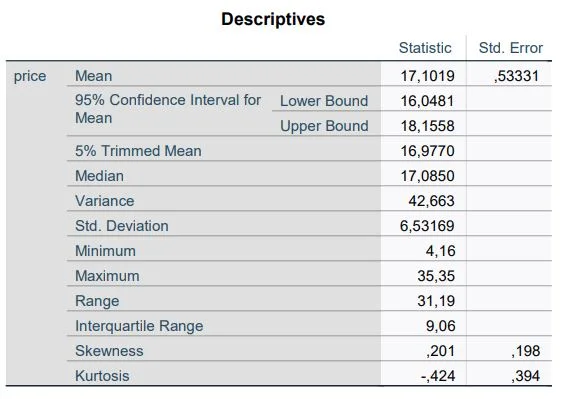
If both values have the value 0, a normal distribution can be assumed. However, this is only a theoretical value. In real experiments, both values can be larger or smaller than zero.
As a rule, the values must not be greater than 1 and not less than -1 to assume a normal distribution.
In our example, the size ratio has a skewness of .201 and kurtosis of -.424. The numbers indicate a normal distribution of the results.
Explanation kurtosis

The kurtosis indicates how far the margins of a distribution deviate from the normal distribution. Kurtosis allows you to gain an initial understanding of the general characteristics of the distribution of your data.
Data that perfectly follows a normal distribution has a kurtosis value of 0. Normally distributed data form the baseline for kurtosis. If the kurtosis of a sample is significantly different from 0, it may indicate that the data is not normally distributed.
A positive kurtosis value for a distribution indicates that the distribution is characterized by more pronounced margins than the normal distribution. For example, data that follow a t-distribution have a positive kurtosis value. The solid line represents the normal distribution and the dotted line represents a distribution with a positive kurtosis value.
A negative kurtosis value for a distribution indicates that the distribution is characterized by weaker margins than the normal distribution. For example, data following a beta distribution whose first and second shape parameters are equal to 2 will have a negative kurtosis value. The solid line represents the normal distribution and the dotted line represents a distribution with a negative kurtosis value.
Explanation skewness – Skewness

Skewness indicates the extent to which the data is asymmetric. The skew value – 0, positive or negative – provides information about the shape of the data. As the symmetry of the data increases, its skewness value approaches zero. Figure A shows normally distributed data, which by definition have relatively low skewness. If you draw a line through the center of this histogram of normally distributed data, it will be apparent that the two sides mirror each other. However, a lack of skewness alone does not imply a normal distribution. Figure B shows a distribution where both sides still mirror each other, but the data are not normally distributed at all.
Positively skewed, or right-skewed, data are so designated because the edge of the distribution points to the right and the skewness value is greater than 0 (i.e., positive). Salary data often exhibit such skewness: Many employees of a company receive a relatively small salary, while increasingly fewer individuals receive very high salaries. Left skewed or negatively skewed data are so called because the edge of the distribution points to the left and there is a negative skew value. Data on failure rates are often left skewed. Incandescent lamps are an example: very few burn out immediately, and the vast majority have a long life.
Test for normal distribution with the Shapiro-Wilk test in SPSS
The normal distribution can be determined using the Shapiro-Wilk test. After the calculation above, we find the results in the output in SPSS.
What is the Shapiro-Wilk test?
The Shapiro-Wilk test is a statistical test used to check whether a given data set is normally distributed or not. It was developed by Samuel Shapiro and Martin Wilk and is one of the most commonly used tests for checking the normal distribution of data.
The test is based on comparing the Empirical Distribution Function (ECDF) of the data with the Theoretical Distribution Function of a normal distribution. If the two agree well, it indicates that the data are normally distributed. However, if they are significantly different, this indicates that the data are not normally distributed.

For this purpose, we turn our attention to the table “Tests of Normality”. The first column lists the variables under investigation. The last column shows the significance value of the Shapiro-Wilk test. Any value above 0.05 indicates a normal distribution. But be careful: the Shapiro-Wilk test tends to be overcritical with larger samples and to negate normal distributions even if they can actually be assumed.
In our example, the variable price in EUR (.150) is normally distributed. The variable Price in EUR is not significant and therefore normally distributed.
Why are there two columns of significances? SPSS calculates the significances using the Kolmogorov-Smirnov test and the Shapiro-Wilk test. In contrast to the Kolmogorov-Smirnov test, the Shapiro-Wilk test has a higher powerStatistische Power Statistische Power ist die Wahrscheinlichkeit, dass ein statistisches Testverfahren einen wirklich vorhandenen Unterschied zwischen zwei Gruppen oder Bedingungen erkennen wird. Eine hohe statistische Power bedeutet, dass das Testverfahren empfindlich genug ist, um kleine Unterschiede zu erkennen, während eine niedrige statistische Power dazu führen kann, dass wichtige Unterschiede übersehen werden. Es ist wichtig, dass die statistische Power bei der Planung einer Studie berücksichtigt wird, um sicherzustellen, dass das Testverfahren ausreichend empfindlich ist, um wichtige Unterschiede zu erkennen. , which is why it should usually be used.
What is the Kolmogorov-Smirnov test?
Testing for normal distribution using the Kolmogorov-Smirnov test is not unlike the Shapiro-Wilk test. The output is in the same table. Usually, the Kolmogorov-Smirnov test is used when the sample size is very large (N>5000). Therefore, the Shapiro-Wilk test should usually be used.
Testing the normal distribution: diagrams
Histograms
A histogram represents the frequencies within the variable with columns. size again. This corresponds to the normal distribution.
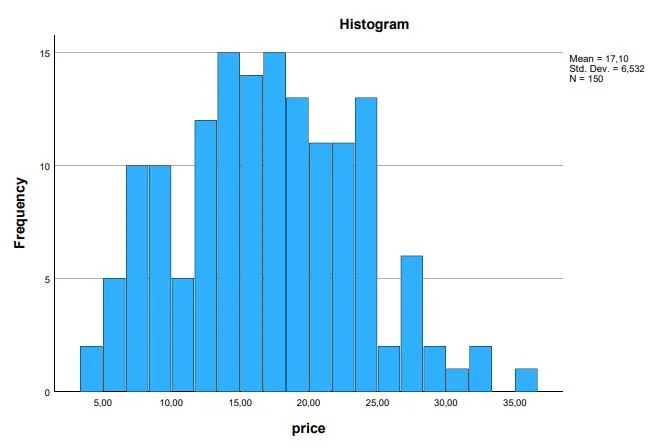
In our example, most prices lie around the middle. The more extreme values become towards the bottom or top, the rarer values are found in the data set.
What is a histogram?
A histogram is a graph used to represent the frequency of data in specific ranges or classes. It consists of a series of vertical columns that represent the frequency of data in specific class ranges. The class ranges are listed on the horizontal axis and the frequency of the data is shown on the vertical axis.
Histograms are particularly useful for plotting data that are concentrated in a particular area or that have a particular shape or structure, such as the distribution of age or salary in a particular population. They can also be used to compare distributions of data or to examine the normal distribution of data.
QQ-Plots
Another way to check the data graphically for a normal distribution are the QQ-plot diagrams.
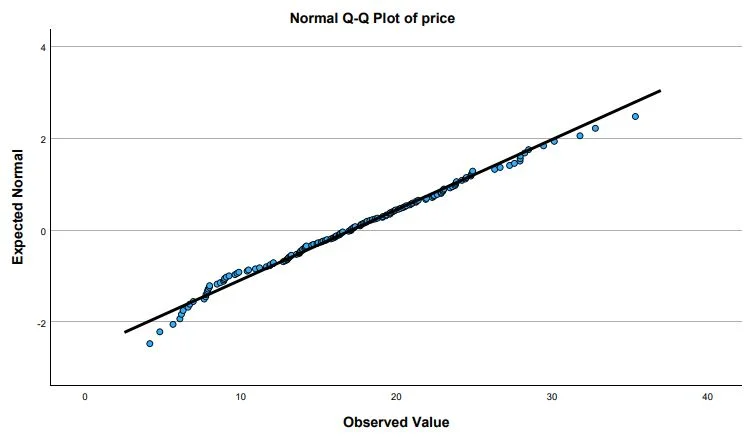
The data are normally distributed if the points are on the line. If the points deviate from the plotted line, we can assume outliers. If the distribution resembles a staircase (with multiple levels), there is rounded or discrete data in the data set.
In our example, the QQ plot of the variable price in EUR indicates a normal distribution. The values are very close to the line. Only at the extreme values are there minor deviations.
What is a QQ plot?
A Q-Q plot, also called a quantile-quantile plot, is a graph used to compare the distribution of data to a normal distribution. It is often used to test the normal distribution of data or to compare the distribution of data to a known normal distribution.
A Q-Q plot consists of two axes that represent the quantiles of the data. The quantiles are the values that represent a certain frequency of the data. For example, the middle 50% of the data are the quantiles that represent the median values.
Describing the Results
The variable ‘Price in EUR’ was normally distributed according to the Shapiro-Wilk test.
5 facts about the normal distribution
- The normal distribution is an important distribution in statistics and occurs in many application areas. It describes a symmetrical distribution in which the data are distributed around a mean value (the arithmetic mean).
- The normal distribution has a characteristic shape in the form of a bell curve and is defined by two parameters, namely the expected value (mean) and the standard deviation.
- In many cases, the assumption of a normal distribution is assumed as a prerequisite for the validity of analytical methods. Therefore, it is important to check the normal distribution of the data before proceeding with the analysis.
- There are several ways to check for normal distribution, including distribution tests and graphs such as histograms and Q-Q plots.
- If the data is not normally distributed, there are alternative methods of analysis that are appropriate for non-normally distributed data. It is important to consider the nature of the distribution of the data in order to determine the appropriate analysis method
Frequently asked questions and answers: Checking Normal Distribution in SPSS
How to test for normal distribution?
In SPSS there are several ways to test the normal distribution of data. One way is to use the “Normal Distribution Test”. This test is found in the “Analysis” menu under “Descriptive Statistics”. When you select this test, you can select the data field you want to examine and SPSS will then produce a series of statistics and graphs that will help examine the normal distribution of the data.
Another option is to use normal distribution plots. These plots can be found in the Graph menu under Charts. When you create a normal distribution plot, you can select the data field you want to examine and SPSS will plot a normal distribution curve over the actual data values. This can help visually confirm or reject the normal distribution.
There are also other tests and methods that can be used in SPSS to test the normal distribution of data, such as the Q-Q plot or the Anderson-Darling test. It is important to note that no test is perfect and that it usually depends on several tests and methods to get a reliable estimate of the normal distribution of data.
What to do when data is not normally distributed SPSS?
If you find that your data is not normally distributed, there are some things you can do in SPSS to analyze the data anyway. Here are some possibilities:
Use nonparametric tests: when data are not normally distributed, nonparametric tests can be used instead of parametric tests. These tests are less demanding in terms of assumptions about the distribution of the data and therefore can be useful for data that are not normally distributed. You can find nonparametric tests in SPSS under the Analysis menu under Nonparametric Tests.
Transform the data: In some cases, the data can be transformed to make it more normally distributed. For example, the data can be logarithmized or they can be taken square roots. These transformations can change the distribution of the data and make it more normally distributed.
Use more robust statistics: In some cases, you can use more robust statistics that are less prone to outliers and non-normally distributed data. For example, medians can be used instead of means, and median-absolute deviation can be used instead of standard deviation.
Use other distributions: In some cases, distributions other than the normal distribution can be used to analyze the data. For example, a t-distribution or a Cauchy distribution could be used if the data have long tail distributions.
It is important to note that none of these options are perfect and that it usually depends on several factors to determine the best approach for analyzing data that is not normally distributed. A good starting point is to first try to improve the normal distribution of the data by using transformations or more robust statistics. If this is not possible, you can consider nonparametric tests or other distributions.
When which test for normal distribution?
There are many tests that can be used to check the normal distribution of data. Which test is most appropriate depends on several factors, such as the size of the sample, the shape of the distribution, and the software package available. Here are some general guidelines for selecting tests to test for normal distribution:
If you have a small to medium sample size and want an easy-to-use test, you could use the normal distribution test. This test is available in SPSS and also calculates statistics and produces a histogram and normal distribution plot to visually confirm or reject the normal distribution. See these instructions.
If you have a small to medium sample and want an accurate test, you could use the Shapiro-Wilk test. This test is one of the most accurate tests for normal distribution, but note that it is not available in some software packages.
If you have a sample of any size and want a slightly more accurate test, you could use the Anderson-Darling test. This test can be used for samples of any size, but note that it can be more difficult to interpret for inexperienced users.
If you want a visual method for testing the normal distribution that is suitable for samples of any size, you could use Q-Q plots. These plots are available in many software packages and are easy to interpret, but note that they are less accurate than other tests.
Which variables to test for normal distribution?
There is no definitive answer as to which variables should be tested for normal distribution, as this depends on the nature of the study and the methods of analysis used. However, the following considerations are usually taken into account:
If you are going to use parametric tests, you should test for normal distribution from the variables that are used as output variables in these tests. These tests assume that the data are normally distributed and may give unreliable results if the data are not normally distributed.
If you want to examine the distribution of characteristics or traits in your sample, you should check the normal distribution of these variables. This may be the case, for example, when examining age, gender, or education level.
If you want to examine the relationship between different variables, you should check the normal distribution of both variables. This is especially important if you want to perform correlations or regression analyses.
It is important to note that the normal distribution of variables is not always necessary to gain important insights from your study. If your data is not normally distributed, there are other methods.
When to use Kolmogorov Smirnov test?
The Kolmogorov-Smirnov test is a non-parametric test used to check whether a given sample of data comes from a particular distribution. It is often used when one does not know much about the distribution of the data or when the data does not have a normal distribution.
An example of when one might use the Kolmogorov-Smirnov test is when one wants to check whether the sizes of parts produced in a factory conform to a particular size distribution. One could measure the sizes of the parts and use the Kolmogorov-Smirnov test to verify that the size distribution of the parts matches the expected distribution.
There are many other use cases for the Kolmogorov-Smirnov test. It is commonly used in statistics and in many other areas where you want to check the distribution of data.
Which test if not normally distributed?
If the data does not have a normal distribution, there are some tests that can be used instead. One possibility would be the Kolmogorov-Smirnov test that was mentioned. This is a non-parametric test used to check whether a given sample of data comes from a particular distribution. It is often used when not much is known about the distribution of the data or when the data do not have a normal distribution.
Another test that can be used when the data does not have a normal distribution is the Wilcoxon-Mann-Whitney test. This is also a non-parametric test used to check if two samples of data are from the same distribution. It is often used when the samples are not normally distributed or when the samples are very different in size.
There are many other tests that can be used when the data does not have a normal distribution. Which test is best depends on the specific characteristics of the data and the question you want to answer. It is important to realize that the assumption of normal distribution in many statistical tests is an assumption that often does not hold in the real world. It is therefore important to check the distribution of the data and use appropriate tests when the normal distribution cannot be assumed.
When to use Mann Whitney U Test?
The Wilcoxon-Mann-Whitney test, also known as the Mann-Whitney U test, is a non-parametric test used to test whether two samples of data come from the same distribution. It is often used when the samples are not normally distributed or when the samples are very different in size.
An example of when you might use the Mann-Whitney U test is when you want to check if there is a difference in the average sales figures between two different types of goods. One could measure the sales figures for each type of product and use the Mann-Whitney U test to check if there is a statistically significant difference between the sales figures of the two types of products.
There are many other uses for the Mann-Whitney-U test. It is commonly used in statistics and in many other areas where you want to check whether two samples of data come from the same distribution. As with any statistical test, it is important to understand the assumptions of the test and make sure that the test is appropriate for the specific data and question.
What correlation if not a normal distribution?
If the data do not have a normal distribution, one might consider using a non-parametric correlation method instead. For example, one such method would be the Spearman rank correlation coefficient.
The Spearman rank correlation coefficient is a non-parametric method for measuring the correlation between two variables. Unlike the Pearson correlation coefficient, which is used to calculate the correlation between normally distributed variables, the Spearman rank correlation coefficient can be used to measure the correlation between variables of any distribution.
An example of when one might use the Spearman rank correlation coefficient is when one wants to check if there is a correlation between the size of companies and their financial success. One could measure the size of companies by their number of employees and financial success by their profits. If the data does not have a normal distribution, one could use the Spearman rank correlation coefficient to check if there is a correlation between these two variables.
There are many other non-parametric correlation methods that one could use if the data does not have a normal distribution. The most appropriate method depends on the specific characteristics of the data and the research question. It is important to realize that the assumption of normal distribution in many statistical tests and methods is an assumption that often does not hold in the real world. It is therefore important to check the distribution of the data and use appropriate methods when the normal distribution cannot be assumed.
Wann Shapiro Wilk or Kolmogorov Smirnov?
The Shapiro-Wilk test and the Kolmogorov-Smirnov test are both tests used to verify that a given sample of data comes from a normal distribution. The Shapiro-Wilk test is a parametric test that assumes the data is normally distributed, while the Kolmogorov-Smirnov test is a non-parametric test that is appropriate for data of any distribution.
When to use the Shapiro-Wilk test or the Kolmogorov-Smirnov test depends on the distribution of the data and the research question. If one assumes that the data are normally distributed and has enough observations (usually more than 50 observations), then one could use the Shapiro-Wilk test. If one cannot assume that the data is normally distributed or has fewer than 50 observations, then one could use the Kolmogorov-Smirnov test instead.
It is important to note that the assumption of normal distribution in many statistical tests is an assumption that often does not hold in the real world. It is therefore important to check the distribution of the data and use appropriate tests if the normal distribution cannot be assumed.

