Linearity in statistics
An important requirement for performing calculations in SPSS is linearity between the dependent variable and the independent variables. Linearity states that the relationship between the variables is linear, meaning that the change in the dependent variable is proportional to the change in the independent variable. If linearity is not present, the results of the regression can be distorted and it can be difficult to correctly interpret the meaning of calculations such as regression coefficients.
Therefore, it is important to check linearity before proceeding with calculations.
How to check linearity?
There are several ways to check whether a relationship between two variables is linear. One way is to plot the data using a scatter plot and then check if the points roughly follow a straight line. This method is called graphing and is very popular and relatively easy to do. This tutorial will show you step by step how to do it.
Additional methods for testing linearity
Correlation coefficient: The correlation coefficient (r) indicates how strongly the two variables correlate with each other. A value of 1 indicates a perfect positive correlation, while a value of -1 indicates a perfect negative correlation. A value of 0 means that there is no correlation. A high absolute value of r indicates a strong correlation, while a low value indicates that there is no correlation or only a weak correlation.
Linear Regression: Another way to test for linearity is to apply linear regression to the data. By calculating the regression lines and the standard errors of the estimates of the regression parameters, one can determine whether or not a linear relationship exists.
Coefficient constancy: If the relationship between variables is linear, the coefficients indicating the strength of the relationship between variables should remain constant across different subsets of the data. One can check this by dividing the data into different subgroups and then computing a separate regression for each subgroup. If the coefficients are similar in all subgroups, this indicates a linear relationship.
Tutorial: Testing linearity in SPSS with scatterplots for multiple variables – Scatterplots
This tutorial shows you how to test the linearity of variables in SPSS with scatterplots.
Selection of diagrams in SPSS

In the menu at the top, we click on the “Graph” menu item and select the “Scatter/Point Plot” option from the menu.
Note: Instead of the Charts menu item, some older versions of SPSS use the term Graph.
Selection matrix scatterplot

Next, we select the “Matrix Scatterplot” option in the dialog box and click “Define”.
Selection of variables for testing linearity in SPSS

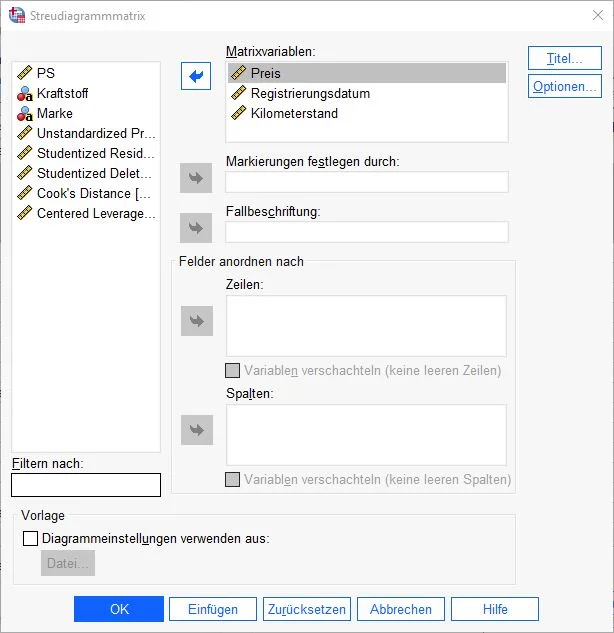
A dialog box appears with the available variables displayed in the left column. Now we select the variables that will be examined in the Matrix Variables field by clicking on the blue arrow.
Then we select OK to finish the settings and call the diagram.
Output: Scatter plots in overview (matrix)

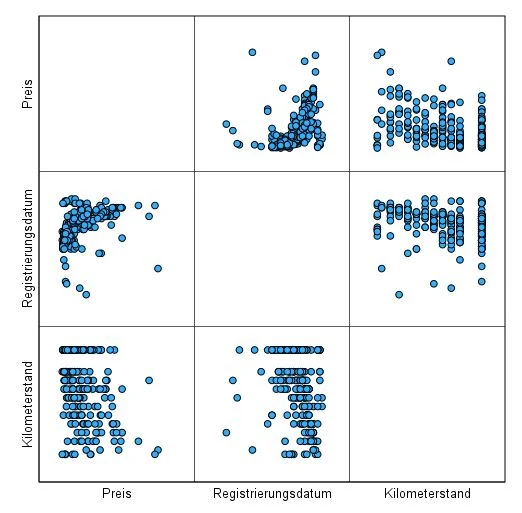
SPSS gives us a new chart in the output. It is a matrix scatter plot and compares the scatter of each variable with each other in a table. Price versus mileage, etc. The handy thing is that we don’t have to create each individual chart ourselves, so we get a quick overview.
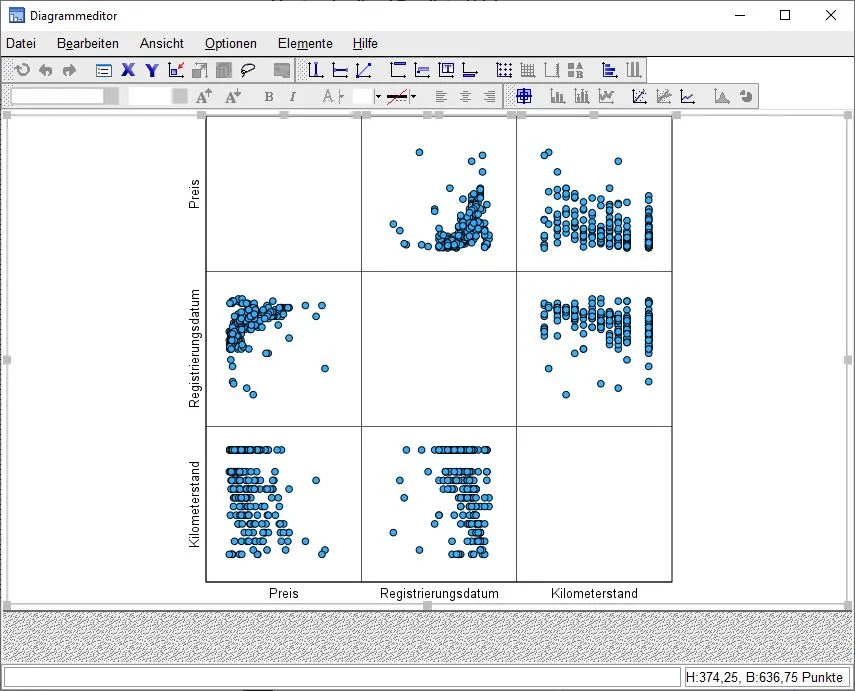
When testing linearity with scatter plots, SPSS still gives us a help. To activate it, we proceed like this. With the left mouse button we make a double click on the diagram. This opens the editor.
Matrix Scatterplot Editor

The editor is a tool to edit the diagram according to our wishes. There are numerous options that we won’t go into because we don’t need them. What we do need are guides.
Add auxiliary lines

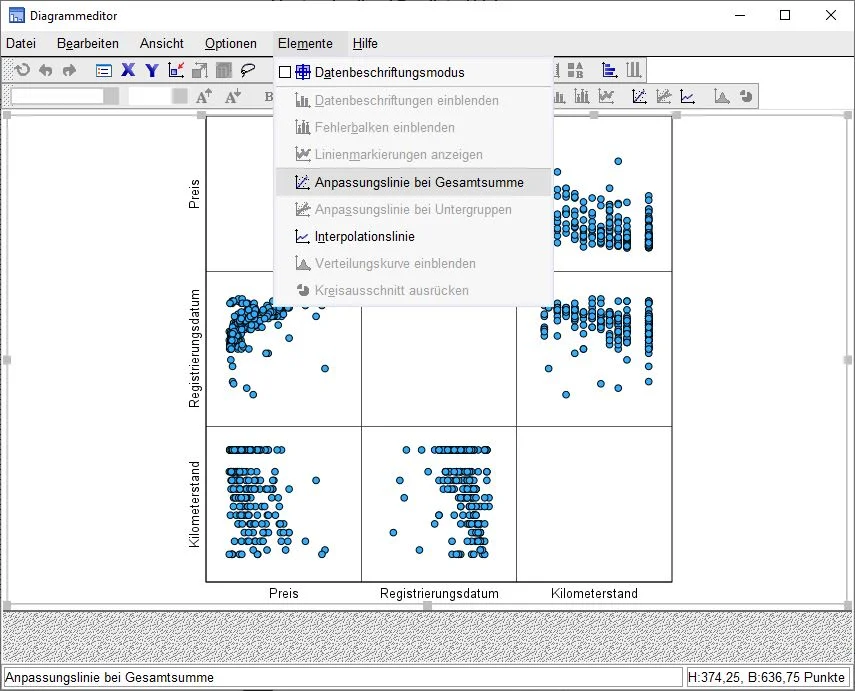
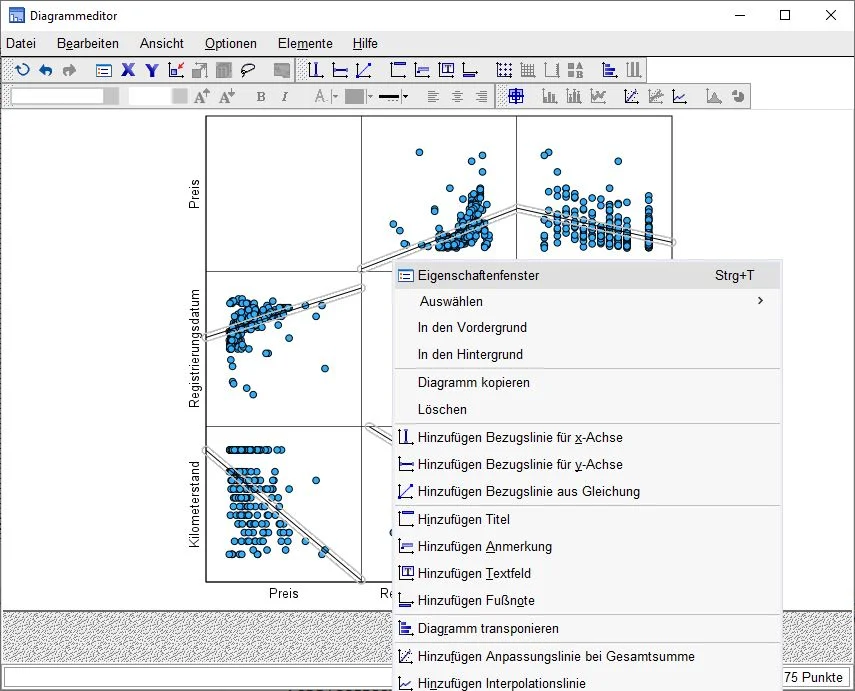
In the editor there is a menu at the top. We click on Elements > Adjustments at Total.
Check linearity in SPSS Edit guides

The editor inserts an auxiliary line in all scatter plots. The system shows us a straight line drawn through the data set. This is a good start, but we want to see something else. We right-click on a straight line to open the context menu (as in the screen shot). Here we click on the “Properties Window” option.
Note: Depending on how slow your computer is, input to the editor may be severely delayed. Because this process is so computationally intensive, your PC will not respond as quickly. Therefore, the inputs should be precise and keep your patience.
Determine fitting line

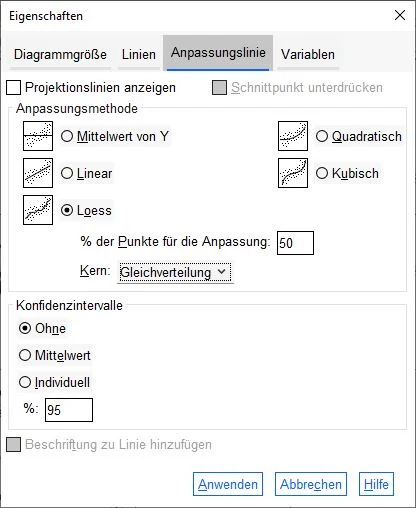
Wir wollen festlegen, wie die Hilfslinien berechnet werden. In der Dialogbox klicken wir auf die Registerkarte Ausgleichslinie. Dort wählen wir die Ausgleichungsmethode “Löß” mit 50% Ausgleichung und “Gleichverteilung” als Kern.
Dann klicken wir auf die Schaltfläche Übernehmen, um die Einstellungen zu übernehmen.
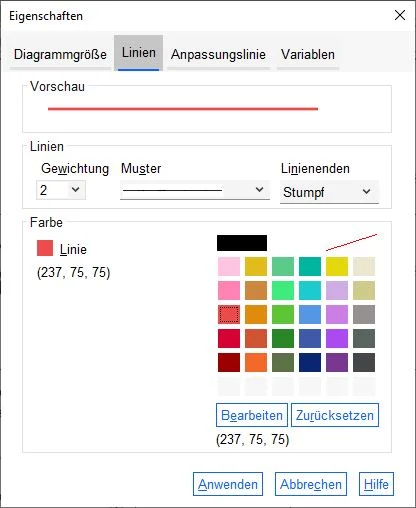
Customize auxiliary lines in scatter plot

Anpassen von Hilfslinien im Streudiagramm
End editor

We close the editor by clicking on the X in the editor window.
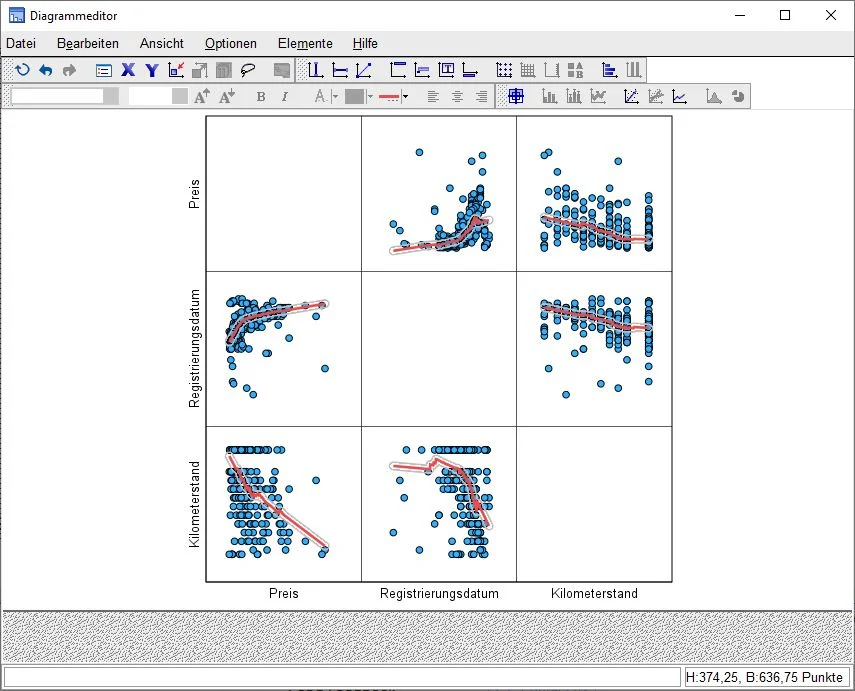
Analyze results

In the output we see Loess fitting lines, which give us an indication of linearity. Linearity is given when the drawn adjustment lines are straight. It is as simple as that. The interpretation of the lines should not be too strict, if in marginal areas and at a few points linearity is not quite observed, linearity can still be assumed.
Test of linearity in SPSS by studentized residuals
In SPSS, we can not only run the measures described above but also a linearity test. By looking at the studentized residuals we also have an insight on the linearity of variables. To calculate this method, it is necessary to have certain variables created by SPSS (PRE_1 and SRE_1).
1. Select scatter plot
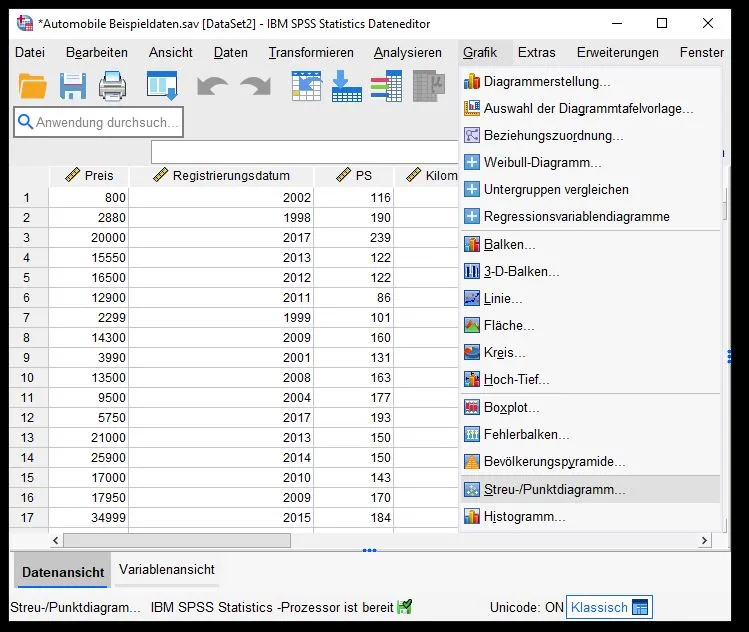
To check linearity, we proceed as follows: We navigate as follows: Graph > Scatter/Point Plot… and click on the option in the menu.
2. Scatter plot dialog box
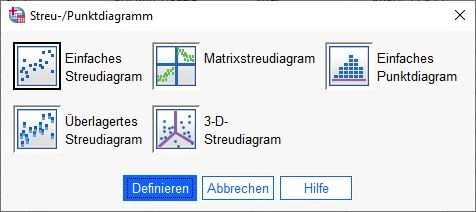
In the dialog box we click on “Simple Scatterplot” and then on the Define button.
3.Simple Scatter Plot Dialog Box
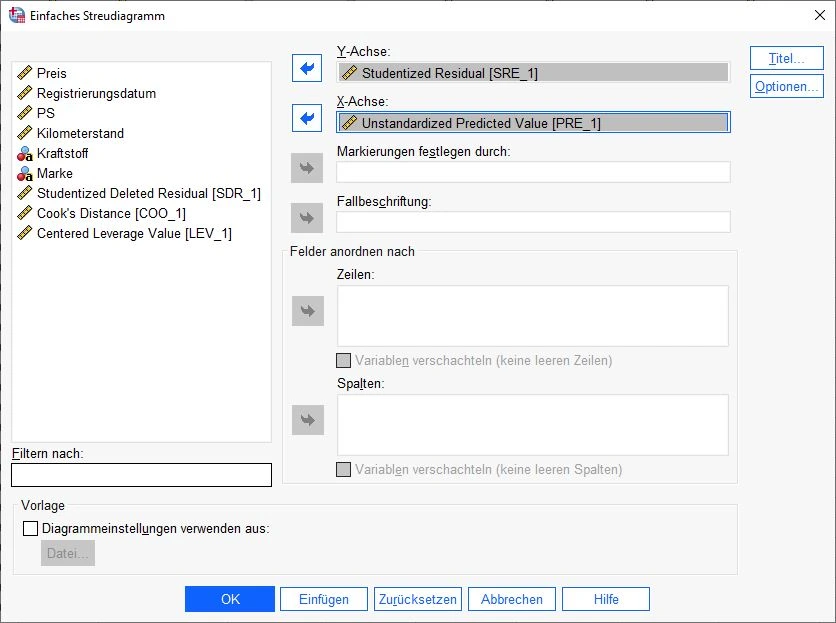
In the dialog box we see several fields for variables.
- In the upper field “Y-axis” we insert the variable SRE_1 (unstandardized predicted values).
- In the field “X-axis” we insert the variable “PRE_1” (studentized residuals).
Then we click on the OK button at the bottom to confirm the entries.
4. Analysis of the diagram
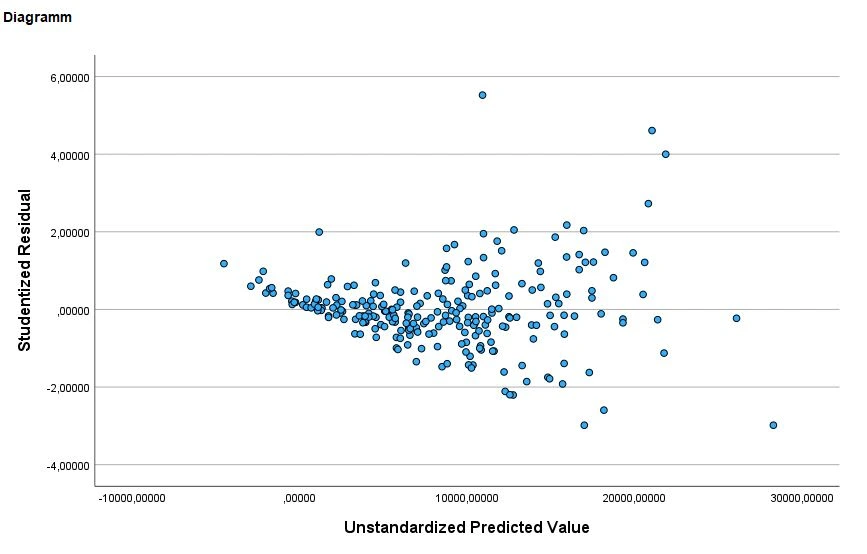
SPSS created a chart for us that shows us the distribution of data points for both variables. At best, the data points should be evenly distributed with as little compression as possible. In our example, the data is somewhat compressed.
Note: It is important to note that the interpretation of these graphs can be subjective. It is easy to overinterpret these graphs and view any deviation as potentially problematic, especially for people who are learning about residual analysis for the first time.
One more note: Special care should be taken when calculating residual plots for data sets that are too small. If there are too few data, no meaningful conclusions can be drawn.
Conclusion Linearity test
Linearity is an important factor in many statistical analyses, as it is a prerequisite for the validity of many analytical methods. Linearity describes the nature of the relationship between two variables and can occur in various strengths and forms. A linear relationship exists when the change in one variable is directly proportional to the change in the other variable.
It is important to note that linearity is not always present and that there are also cases where a different type of relationship exists between variables. In such cases, special methods of analysis may be required that are appropriate for non-linear relationships. It is therefore always advisable to check linearity carefully and, if necessary, make appropriate adjustments to ensure the validity and significance of the analysis results.
Frequently asked questions and answers: Check linearity in SPSS
What do I do if my variables are not linear?
If your variables are not linear, there are a few ways you can adjust your analysis:
Transformations: One way is to transform the variables to make them linear. For example, you could take the variables in their logarithms or transform them quadratically.
Non-linear regression: Instead of linear regression, you could use non-linear regression to model the relationship between the variables. There are several types of non-linear regressions, such as polar regression or logistic regression.
Regression Curve Fitting: You could also try to model the relationship between the variables using regression curve fitting. This involves fitting a curve to the data to describe the relationship between the variables.
Other analysis methods: There are other analysis methods that are appropriate for non-linear data, such as factor analysis or cluster analysis.
It is important to note that each of these methods has its own advantages and disadvantages and that no one method is appropriate for all data sets. It is important to consider the specific characteristics of your data and the research question when deciding which method is best for your analysis.
Why should I test linearity in statistics?
It is important to check linearity in statistics because many statistical tests and procedures assume that the data are linear. If the data are not linear, the results of the analysis may be skewed and the conclusions one draws from the results may be inaccurate.
Checking for linearity is especially important when performing regression analyses or other analyses that attempt to model the relationship between two or more variables. If the relationship between variables is not linear, linear regression may not be the best way to describe the relationship.
There are several ways to test for linearity in the data, such as visualizing the data using scatter plots or calculating correlations. If one finds that the data is not linear, there are several ways one can adjust the analysis, such as using transformations or non-linear regressions.
When is linearity given?
Linearity is given when the relationship between two or more variables is linear. This means that the changes in one variable are in direct proportion to the changes in the other variable.
A simple way to determine if linearity exists is to visualize the data using scatter plots. If the data points lie on a straight line, linearity is probably present. You can also calculate the correlation to see if linearity is given. If the correlation is close to 1 or -1, linearity is likely given.
It is important to note that there may be cases where linearity is only approximately given or where linearity is given to certain conditions. In such cases, it may be useful to examine linearity more closely or to use special procedures to model the relationship between variables.
An example of linearity in statistics?
An example of linearity in statistics would be the relationship between the average temperature and the number of tourists traveling to a particular city. Suppose we have data on the average temperature and the number of tourists for the last 10 years. If we visualize the data by plotting the average temperature on the x-axis and the number of tourists on the y-axis, we may see a linear relationship between the variables: The higher the average temperature, the more tourists visit the city.
In this case, linearity would be present because the changes in the number of tourists are directly related to the changes in the average temperature. We could also calculate the correlation to see if linearity is given. If the correlation is close to 1 or -1, that would indicate that linearity is given.
How do you recognize a linear relationship?
There are several ways to detect a linear relationship between two or more variables:
Visualizing the data: One way is to visualize the data using scatter plots or line plots. If the data points lie on a straight line, linearity is likely present.
Calculate correlation: You can also calculate the correlation to see if linearity is given. If the correlation is close to 1 or -1, linearity is likely given.
Perform linear regression: Another option is to run a linear regression and look at the R-squared. If the R-squared is close to 1, it means that linearity is well given.
It is important to note that there may be cases where linearity is only approximately given or where linearity is given to certain conditions. In such cases, it may be useful to examine the linearity more closely or to use special procedures to model the relationship between the variables.
What are further links on the topic of checking linearity?
The official coach of SPSS (a bit confusing): IBM SPSS
Theoretical exercises: max-academy.de
Theoretical paper Check linearity: wikibooks.org
What is linearity statistics?
Linearity in statistics refers to the relationship between two or more variables where the changes in one variable are in direct proportion to the changes in the other variable. This means that the relationship between variables can be described by a straight line.
Linearity is an important concept in many areas of statistics because many statistical tests and procedures assume that the data are linear. If the data is not linear, the results of the analysis can be skewed and the conclusions drawn from the results can be inaccurate.
There are several ways to check for linearity in the data, such as visualizing the data using scatter plots or calculating correlations. If one finds that the data is not linear, there are several ways one can adjust the analysis, such as using transformations or non-linear regressions.
More questions about Check linearity in SPSS
- How can I detect outliers in SPSS and assess their impact on the linearity of the data? How to find outliers
- How can I check the internal and external validity of a linear regression in SPSS? Instructions for internal and external validity
- How can I determine or support the reliability of a linear regression in SPSS? Instruction reliability

