The Spearman correlation, also called rank correlation, is a statistical method for measuring the strength and direction of a monotonic relationship between two variables. Unlike the Pearson correlation, which measures the linear relationship between variables, the Spearman correlation examines the monotonic relationship, which can also be described as non-linear. It is often used in social sciences, biology and other fields where the data is not necessarily normally distributed.
What does the Spearman correlation calculate?
Spearman correlation calculates the strength and direction of a monotonic relationship between two variables. This means that it measures the similarity between the ranks of the two variables, rather than the similarity between the actual values. A result of 1 indicates a perfect positive correlation, where the ranks of both variables are identical. A result of -1 indicates a perfect negative correlation, where the ranks of the two variables are exactly opposite. A result of 0 indicates no correlation.
It is important to note that Spearman correlation only measures the linear relationship between variables and not causality.
The difference between causality and correlation
The Spearman correlation coefficient only measures the strength and direction of a monotonic relationship between two variables. It says nothing about whether one variable influences the other (causality). There are cases where there is a strong correlation between two variables but no causality. This is often caused by joint third effects, which means that a third variable influences the other two, resulting in a correlation between them. It is also possible for a correlation to occur due to chance or measurement error. To prove causality, further studies are needed, such as experimental or causal-analytical methods.
When is the Spearman-Rho correlation used?
Spearman correlation is used in many fields, especially in the social sciences, biology, medicine and other fields where the data are not necessarily normally distributed. It is often used when the data is ordinal, interval or ratio. Some examples of the use of Spearman correlation are:
- In medicine, to study the relationship between certain risk factors and a disease.
- In biology, to study the relationship between two biological variables, such as animal height and weight.
- In the social sciences, to study the relationship between different variables such as education level and income.
- In psychology, to study the relationship between different psychological variables such as personality and life satisfaction.
It is important to note that the Spearman correlation is not appropriate when the data are nominal. In this case, the kappa correlation or the chi-square dependency test can be used.
Requirements
The Spearman rank correlation coefficient is much more robust than the Pearson correlation coefficient calculations when it comes to outliers, normal distribution or the scale levels. Here are the conditions:
- Both variables must be at least ordinally scaled.
- If both variables are interval scaled, the Pearson product-moment correlation should be used.
- Nominal scaled variables should not be used.
- Find out more about scale levels.
Calculate Spearman correlation in SPSS
Calculation of the correlation with SPSS
Selection in the menu

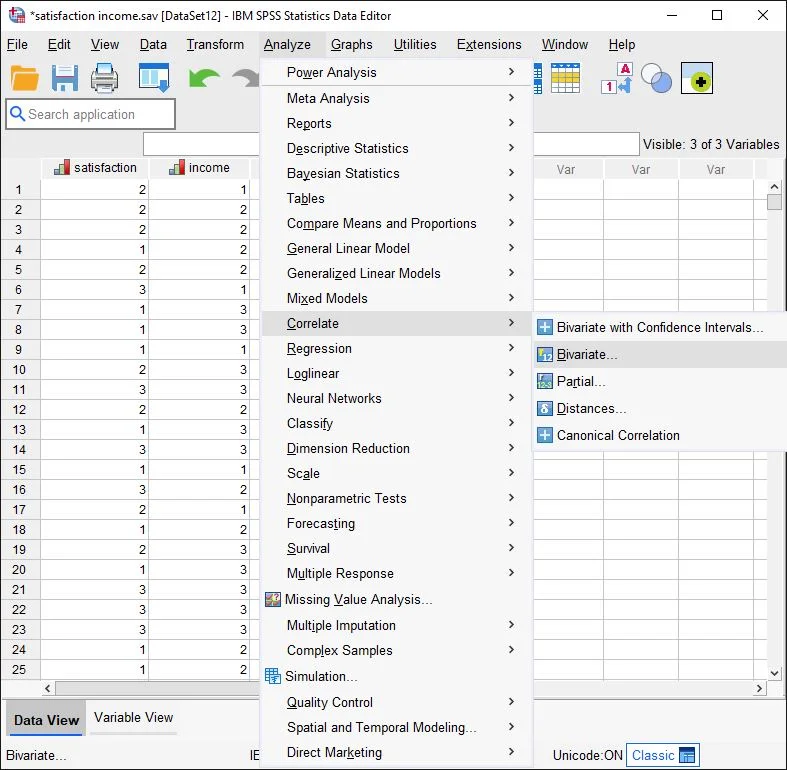
In the menu we click on Analyse > Correlate > Bivariate.
Bivariate Correlations

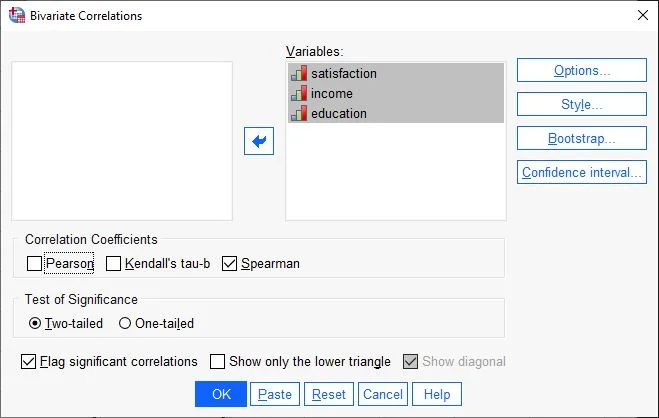
A dialogue box appears. In the left-hand panel are all the available variables from our dataset. On the right side there is a field with the heading Variables. We drag all the variables here that we want to check.
Below the fields we have several options for calculating correlations. We put a tick by Spearman.
The test for significance is usually two-tailed.
The test for significance is usually two-sided.
We put a tick by Flag significant correlations. This is very helpful for large tables with many variables.
In our example, these are the variables life satisfaction, income and education.
Then we click on the Options button on the right-hand side.
Select options

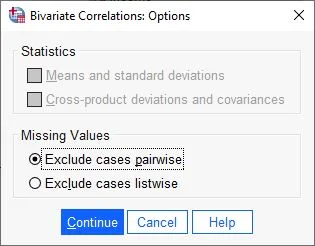
The options window for bivariate correlations appears. Here we make sure that no statistic is selected (because we don’t need it).
In addition, for “Missing values”, the option “Exclude cases pairwise” should be selected.
We confirm our entries by clicking on the Continue button.
Ready to start

We are ready and click on OK. The calculations start. We see the results in the output file of SPSS.
Analysing Spearman-Rho correlation in SPSS
Determine the Spearman correlation coefficient
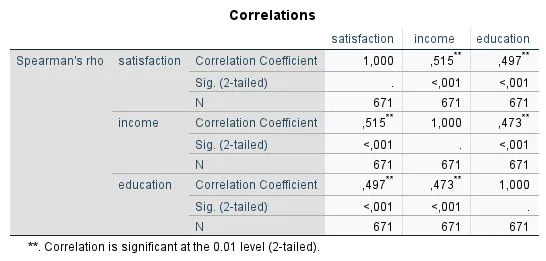
A table called Correlations appears in the SPSS output file. This table contrasts our variables. For this reason, the results mirror each other.
We look at the first row and the value of the Spearman-Rho correlation. We see that the correlation coefficient for life satisfaction versus income (r=.515) and life satisfaction versus education (r=.497). Furthermore, income correlates with education at r=.473.
Second, we look at significance to check whether the results were random or not. Therefore, we look at the Significance (Sig.) line. It gives us the p-value. In our example, we see a significance of p <.001. We match the result with the significance level.
N describes the sample size used for the calculation. In our example, no cases were excluded.

What is the significance level and the p-value?
The significance level in statistics indicates how likely it is that a certain result occurs by chance when there is actually no effect. It is usually expressed as an alpha value (α) and is usually set at 0.05 or 0.01. The alpha value indicates the probability of making a type I error (false positive decision) when there is actually no effect.
The p-value is a statistical measure that indicates the probability that a particular outcome or a greater deviation from zero occurs by chance. If the p-value is smaller than the pre-specified significance level (α), the result is considered significant. This means that it is unlikely that the result occurs by chance and there is probably a real effect. If the p-value is greater than the significance level, the result is considered not significant and no effect is suspected.
Significances can be neither 0 nor 1, but always fall in between. In this case, we would interpret the value as p<.001
What are positive and negative correlations?
The difference between a positive and negative correlation is how the values of the two variables vary together.
A positive correlation means that the values of the two variables tend to vary in the same direction. When one variable increases, the other variable tends to increase as well and vice versa. An example of this would be the correlation between age and experience in a profession, the older you get, the more experience you have in a profession.
A negative correlation means that the values of the two variables tend to diverge in opposite directions. As one variable increases, the other variable tends to decrease and vice versa. An example of this would be the correlation between age and body temperature, the older people get, the lower their body temperature.
Interpret results
The Spearman correlation coefficient is easy to interpret. For this we look at this table according to Cohen (1988)
| Value of the correlation coefficient | Interpretation |
|---|---|
| |r| = .10 | weak (low) |
| |r| = .30 | moderate (medium) |
| |r| = .50 | strong (big) |
Publish results
The Spearman correlation coefficient calculations show a strong correlation between the variables life satisfaction and income, r=.515, p<.001; life satisfaction and education, r=.497,p<.001 and income and education, r=.473, p<.001.
5 Facts about the Spearman-Rho Correlation
- Spearman correlation measures the strength and direction of a monotonic relationship between two variables.
- It examines the similarity between the ranks of the two variables, rather than the similarity between the actual values.
- The Spearman correlation coefficient is always between -1 and 1, where 1 is a perfect positive correlation and -1 is a perfect negative correlation.
- It is not necessary for the data to be normally distributed to calculate the Spearman correlation.
- It is a non-parametric method, which means it does not require any assumptions about the distribution of the data, unlike the Pearson correlation, which assumes normally distributed data
Häufig gestellte Fragen und Antworten: Spearman-Rho KorrelationKorrelation Korrelation bezieht sich auf den Zusammenhang oder die Beziehung zwischen zwei oder mehr Variablen, die durch den Grad der Änderung der Werte einer Variablen im Verhältnis zur Änderung der Werte einer anderen Variablen gemessen wird.
What does the Spearman correlation say?
The Spearman correlation provides information about the strength and direction of a monotonic relationship between two variables. A result of 1 indicates a perfect positive correlation, which means that the ranks of both variables are identical. A result of -1 indicates a perfect negative correlation, which means that the rankings of both variables are exactly opposite. A result of 0 indicates no correlation. It is important to note that Spearman correlation only measures the strength and direction of a monotonic relationship between two variables and does not describe causality. A strong correlation between two variables does not mean that one variable influences the other
When is a Spearman correlation significant?
A Spearman correlation is significant when the p-value of the correlation coefficient is below a certain significance level. The p-value indicates how likely it is that a given correlation coefficient arises by chance due to chance or measurement error. Usually a significance level of 0.05 is used, which means that a p-value below 0.05 is considered significant. If the p-value is below 0.05, one can conclude that there is a significant correlation between the variables and it is unlikely that the correlation is due to chance. However, there are other significance levels, such as 0.01 or 0.1, which can be used depending on the context and requirements.
When is Spearman-Rho correlation used?
Spearman-Rho correlation is used when the data are not necessarily normally distributed. It is particularly suitable for ordinal, interval or ratio data. Some examples of the use of Spearman correlation are:
– In medicine, to study the relationship between certain risk factors and a disease.
– In biology, to study the relationship between two biological variables, such as animal height and weight.
– In the social sciences, to study the relationship between different variables such as education level and income.
– In psychology, to study the relationship between different psychological variables such as personality and life satisfaction.
– In finance, to study the relationship between different financial variables such as stock prices and corporate profits.
– In environmental science, to study the relationship between different environmental variables such as air quality and health.
It is also important to note that the Spearman correlation is not appropriate when the data is nominal. In this case, the kappa correlation or the chi-square dependence test can be used.
External resources for correlation according to Spearman
The Wikipedia article: here
A great explanation of the theory by the University of Zurich: here
Exercises: here


