Independent Samples t-Test in SPSS
An independent t-test, also known as an unpaired t-test, is a statistical method used to determine whether there’s a significant difference between the means of two independent groups. For instance, this might involve comparing the average grades of students using different textbooks. The t-test calculates a value indicating how much the difference between the two group means deviates from zero. It also provides a p-value, which denotes the likelihood that the observed result is due to chance. If the p-value is less than a predetermined threshold, it’s assumed that there is a significant difference between the two groups.
What Does the Independent t-Test Calculate?
The independent t-test calculates the difference between the means of two independent groups. It’s employed to ascertain whether there is a significant difference between the group means.
This test procedure is predicated on the assumption that the two groups are independent and come from normally distributed populations. It computes a t-value, indicating the extent of deviation of the mean difference from zero. Additionally, a p-value is provided, denoting the probability that the observed result is due to chance.
The t-value and p-value are instrumental in accepting or rejecting the null hypothesis. Typically, the null hypothesis is rejected, and a significant difference between the group means is presumed, if the p-value is lower than a predetermined threshold (usually 0.05 or 0.01).
When is the Independent t-Test used?
The independent t-test is utilized when there’s interest in determining if there is a significant difference between the means of two independent groups. Some examples of the independent t-test applications include:
- Comparing the average grades of students using different textbooks.
- Evaluating the effectiveness of a new medication against a control group receiving a placebo.
- Analyzing the average sales figures of products in two distinct regions.
- Examining the average waiting times for patients in two different medical practices.
It’s crucial to note that the independent t-test is appropriate when comparing data from two independent groups, rather than comparing individual subjects’ data before and after a treatment. It’s also essential that the groups are independent and come from normally distributed populations.
Other types of t-tests, such as the paired t-test and multiple t-tests, may be suitable depending on the data characteristics and research questions.
Prerequisites: unpaired t-test
- Scale Levels of Variables: The independent variable should be nominal with two categories, while the dependent variable is interval-scaled. For instance, in our example, the independent variable (IV) is two measurement points: the beginning (Measurement Point 1) and the end (Measurement Point 2) of the study. The dependent variable (DV), which is the measurement outcome at these points, should be interval-scaled. Assess the scale levels by considering your experimental design, without using a specific SPSS function. For detailed explanations, refer to our guide on scale levels here.
- Independent Measurements: A crucial condition for the paired t-test is comparing different measurement subjects. In our case, different individuals are tested at the same time for a measurement (income). It’s important to ensure that no individual is in both groups simultaneously. If there’s no connection between the data points, opt for the independent samples t-test.
- Outliers: Outliers are values that are unusually small or large and negatively affect the analysis by distorting the results. The fewer outliers in a dataset, the better. Here’s a guide for checking statistical outliers.
- Normal Distribution: Ideally, the distributions of the dependent variable should be normally distributed, though it’s not strictly necessary. A good rule of thumb is to ensure your sample size is larger than N=50. If the significance level of the Shapiro-Wilk test is above .05, normal distribution is assumed. For instructions on checking normal distribution, see our guide here.
Note: While ‘measurement timing’ is typically used as the independent variable in a paired t-test, it’s not a strict requirement. Two different conditions can also be applied.
Calculating the Independent t-Test in SPSS
Menu Selection: Independent Samples t-Test

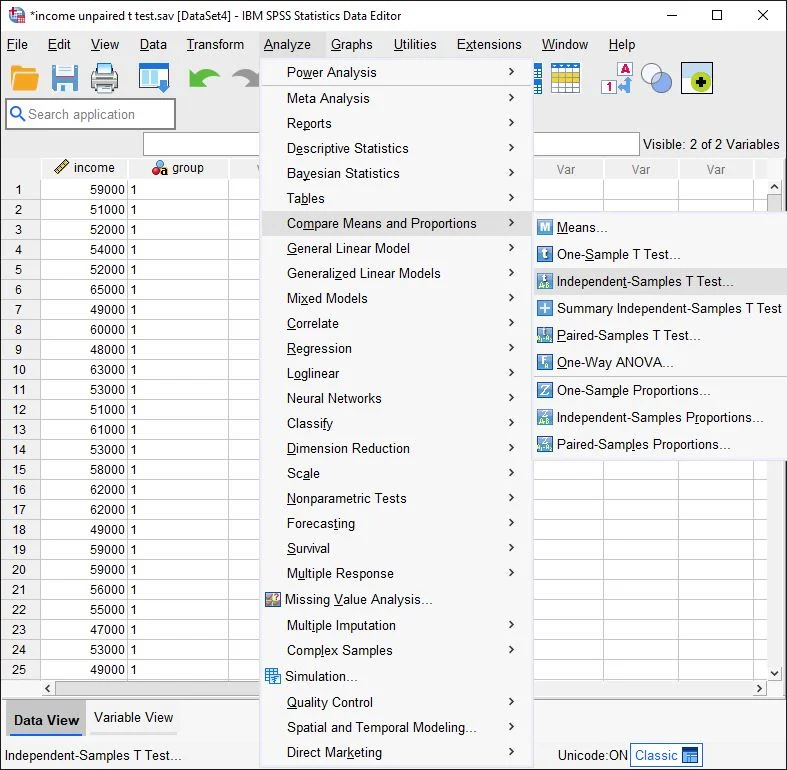
Step 1 in calculating the independent t-test in SPSS: Menu selection Navigate to the top menu and click on Analyze > Compare Means > Independent Samples T Test.
Assigning Variables for the Independent t-Test

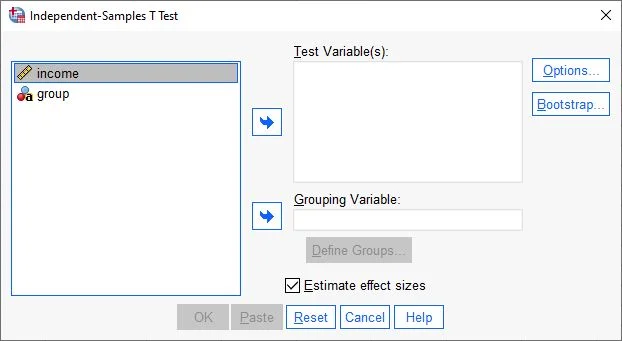
Step 2 in calculating the independent t-test in SPSS: Assigning variables for independent samples t-test The t-test dialog box opens. In the left field, all available variables are displayed. Click on a variable, hold the mouse button, and drag to the appropriate cell in the Test Variables field. Release the mouse button to place the variable in the cell.
Variable Assignment

Step 2 in calculating the independent t-test in SPSS: Assigning variables example Our interval-scaled variable, Annual Income, is in the Test Variables field.
Further down is the Grouping Variable field. Here, we insert our nominal-scaled group variable. In our example, this variable is named Test Group.
Additionally, we check the option to estimate effect sizes.
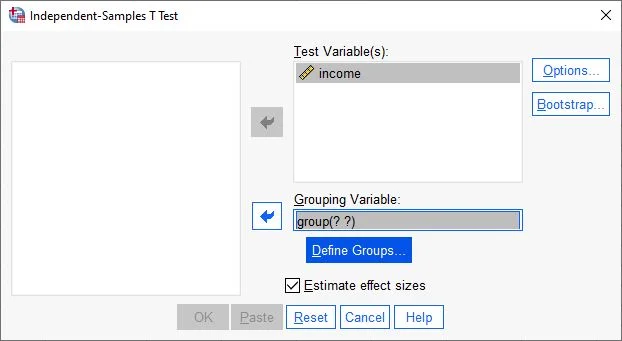
Next, we click on the Define Groups button.Defining Groups: Independent t-Test in SPSS

Step 3 in calculating the independent t-test in SPSS: Defining groups In the Group variable, there are two different values: 1 and 2. In the dialog box, we specify which two groups we want to analyze in the variable. Therefore, we select the two values 1 and 2, as in the example.
Then, we click Continue.
Note: Ensure that you know the names of your groups in your dataset. In the t-test, we can only compare two groups. If you want to analyze more than 2 groups, consider looking at the guide for ANOVA.
Selecting Options

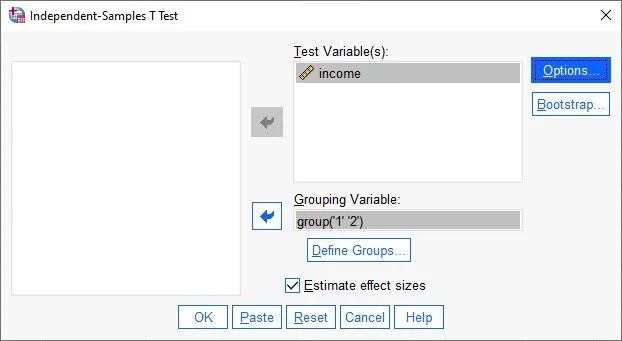
Step 2 in calculating the independent t-test in SPSS: Assigning variables example Next, press the Options button on the right side.
Options: Independent t-Test

Step 4 in calculating the independent t-test in SPSS: Confidence Interval The settings are quite straightforward, and the default settings of SPSS are usually sufficient. In the first field, we specify the significance level, typically 95%. For missing values, we apply the case exclusion analysis by analysis.
After testing the settings, click Continue.
Ready to Start

Step 5 in calculating the independent t-test in SPSS: Variables assigned Click the OK button at the bottom to start the calculation.
Analyzing the Results: Independent t-Test in SPSS
Descriptive Statistics – Group Statistics
SPSS displays several tables in its output. The first table presents descriptive group statistics (Independent Samples Statistics).

We observe the variable ‘Annual Income in Euros’ for both groups, Journalists and Programmers. In the Mean column, we find that journalists earn an average of m = €57,424.25 (sd = €6,756.84), while programmers earn m = €59,980.00 (sd = €7,118.02). ‘N’ counts the number of participants: N = 99 journalists and N = 100 programmers.
This table already hints that journalists, on average, earn less than programmers. The following steps will determine whether this difference is statistically significant.
Independent Samples t-Test


Next, we focus on the table: Test for Independent Samples (Independent Samples Test)
Our attention turns to the last three columns containing the T-value, degrees of freedom (df), and significance level (Sig.).
What do these values mean?
The letter ‘T’ before the parenthesis indicates that the calculation is based on a t-distribution (t-statistic). The number in parentheses represents the degrees of freedom (df). As your sample size changes, so do the degrees of freedom. The T-value after the equals sign refers to a value in a statistical reference book for determining significance (less important). The p-value, following the comma, informs us whether the differences between measurements and groups are significant. A common threshold for significance is p = .05. This means that with a p-value of .05 or lower, the results are considered significant and not due to chance.
Initially, we look at the four rightmost columns in the table. These values are used to form the equation for the t-test:
- The T-value is necessary for determining significance.
- df indicates the degrees of freedom in the calculations.
- Two-tailed p Significance: displays the p-value (significance).
Representation of the Equation for the t-Test
t(df) = T-value, p = two-tailed significance
t(197) = -2.597, p = .01
Calculating Effect Size SPSS

| Value of Effect Size Cohen’s d | Interpretation |
|---|---|
| |d| ≤ 0.2 | Small Effect |
| 0.2 < |d| ≤ 0.8 | Medium Effect |
| |d| > 0.8 | Large Effect |
Publishing Results
There was a significant difference in the measured weights before and after the diet, t(797) = 34.660, p < .001
Frequently Asked Questions and Answers: Independent t-Test
What is a t-test explained simply?
A t-test is a statistical method used to determine whether there is a significant difference between the means of two groups. It is often used to check if the means of treatment and control groups in an experiment differ significantly. There are different types of t-tests, such as the one-sample t-test and the paired t-test.
What does the independent t-test do?
The independent t-test compares the mean of one group with either a known value or the mean of another group, then determines whether the difference between these means is significant. A significant difference suggests it’s probably not due to chance and that a real difference exists between the groups. The t-test also provides a p-value, indicating the likelihood that the observed result is due to chance. A low p-value means it’s unlikely the result is due to chance and that there is a significant difference between the groups.
When do you need an independent t-test?
Independent t-tests are used when interested in whether there is a difference in the means of two groups. For example, one might investigate the effectiveness of a new drug by administering it to one group of patients and comparing their results with a control group that received a placebo. Another instance could be examining whether there is a difference in average grades of students using a new textbook versus those using a traditional textbook. There are different types of t-tests, depending on whether the data are normally distributed, the number of groups, the size of the groups, and other factors.


