SPSS Guide: Mastering the Paired t-Test for Comparative Data Analysis
The paired t-test in SPSS is a straightforward method to compare two related measurements, indicating a dependency or relationship between them. This relationship could be, for example, surveying the same individual at two different points in time. Consider exploring the effect of a diet by weighing a person before and after the diet period. Here, the dependent variable (DV) is the person’s weight, while the independent variable (IV) is the timing of the measurement (pre- and post-diet). It’s crucial to use the same subjects and consistent measurement times. If there’s no link between the data points, opt for the independent samples t-test.
The primary objective of the t-test is to analyze differences in means. A typical study might proceed as follows: To test the impact of a diet, we initially record the weight of all participants multiple times using a scale. We hypothesize a significant weight reduction post-diet. After the diet, assumed to last three months, we measure the weight of all participants again. The focus here is on the mean difference – the variation between the two measurement points.
This approach helps in conducting robust statistical analysis, enabling researchers to draw meaningful conclusions from their data. Understanding the nuances of variables, sample selection, and result interpretation in SPSS can significantly aid students and practitioners in the field of statistics and mathematics.
Prerequisites for Conducting a Paired t-Test in SPSS
- Variable Scale Levels: The independent variable is nominal with two categories, and the dependent variable is interval-scaled. For example, in our study, the independent variable (IV) is the two measurement points – initial and final. The dependent variable (DV), which is the measurement outcome at these points, should be interval-scaled. Assessing scale levels involves analyzing your experiment’s design, not using a specific SPSS function. For more details, see our guide on scale levels.
- Dependent Measurements: A key prerequisite for the paired t-test is comparing the same measurement objects. In our example, the same individuals are measured at different times, not two groups with different subjects. If no connection exists between the data points, opt for the independent samples t-test.
- Outliers: Outliers are unusually small or large values that can negatively impact the analysis by skewing results. The fewer outliers in the dataset, the better. Here’s a guide for checking statistical outliers.
- Normal Distribution: Ideally, the dependent variable’s distributions should be normally distributed, although it’s not mandatory. As a rule of thumb, the sample size should be over N=50. If the Shapiro-Wilk test’s significance level is above .05, normal distribution is assumed. For instructions on checking normal distribution, refer to our guide on normal distribution and the Shapiro-Wilk test.
Note: Typically, ‘measurement timing’ is used as the independent variable in a paired t-test, but it’s not a strict rule. Two different conditions can also be applied.
Calculating the Paired t-Test in SPSS
Menu Selection

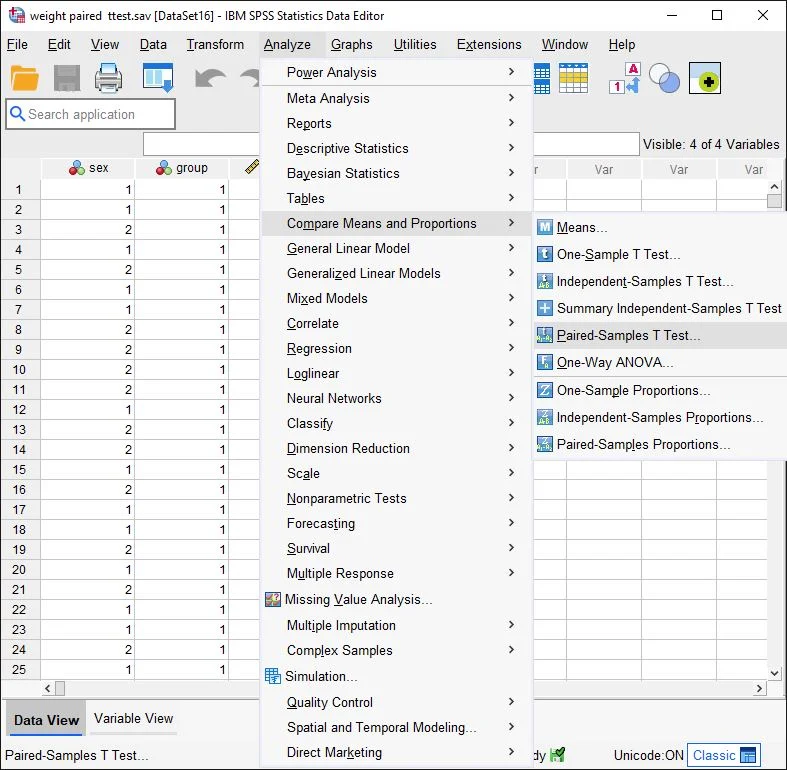
To start, navigate to the top menu and select Analyze > Compare Means > Paired-Samples T Test.
Assigning Variables in the Paired t-Test

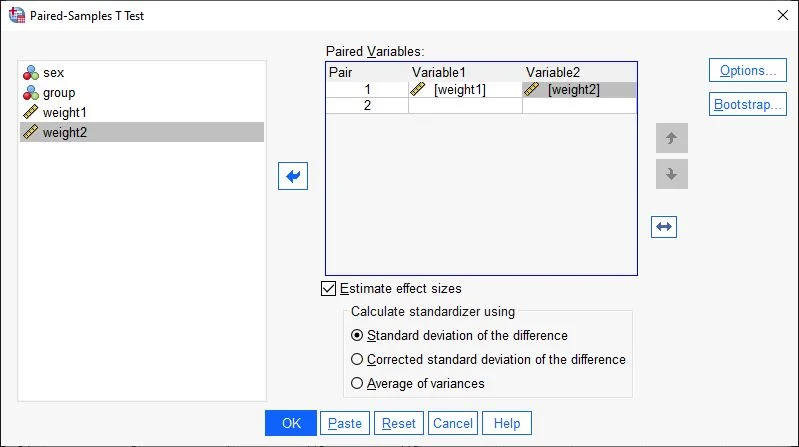
In the t-test dialog box, all available variables will be displayed in the left field. Click on a variable, drag and drop it into the Paired Variables box. This action places the variable in the cell. Since we aim to measure the difference between two variables, position them such that SPSS recognizes them as Variable1 and Variable2. In our example, we add two variables representing weight measurements at different times (Variable 1 and Variable 2).
Check the box for ‘Estimate effect size from standard deviation of the difference.’
Then, click on the Options button.
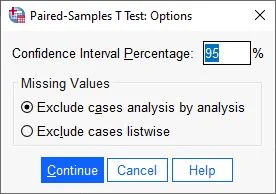
Paired t-Test: Options

In the Options section, it’s usually fine to stick with the default settings, which include: – Confidence Interval Percentage: 95% – Analysis Case Exclusion: Analysis by Analysis
Next, click on Continue.Ready to Start

All set up, click OK to run the paired t-test in SPSS.
Analyzing the Results: Paired t-Test in SPSS
Descriptive Statistics
SPSS outputs several tables. The first one presents descriptive group statistics (Paired Samples Statistics).

Weight 1 corresponds to the first measurement point. In the Mean column, we see that the participants weighed an average of 107.51 kg. ‘N’ represents the number of participants. The other two columns display the Standard Deviation (Std. DeviationStandardabweichung Die Standardabweichung ist ein Maß für die Streuung der Werte einer Variablen um ihren Mittelwert und gibt an, wie sehr die Werte von ihrem Durchschnitt abweichen. Sie wird häufig verwendet, um die Varianz innerhalb einer Population oder Stichprobe zu beschreiben und kann verwendet werden, um die Normverteilung einer Variablen zu beschreiben. Eine kleine Standardabweichung bedeutet, dass die Werte der Variablen dicht um ihren Mittelwert clustern, während eine große Standardabweichung darauf hinweist, dass die Werte der Variablen weiter verteilt sind. ) and the Standard Error of the Mean (Std. Error Mean).
This table already indicates that the average weight at the second measurement (Weight 2) has decreased from 107.51 kg to 102.63 kg. The subsequent steps will examine whether this difference is statistically significant.
Table: Paired Samples t-Test in SPSS

Next, we examine the table: Test for Paired Samples.
Focus on the last three columns containing the T-value, the degrees of freedom (df), and the significance level (Sig.).
What do these values mean?
The letter ‘T’ before the parenthesis indicates that the calculation is based on a t-distribution (t-statistic). The number in parentheses represents the degrees of freedom (df). As the sample size changes, the degrees of freedom also change. The T-value after the equals sign refers to a value in a statistical reference book for determining significance (less important). Following the comma is the p-value, which indicates whether the differences between measurements and groups are significant or not. A common threshold for significance is p = .05. This means that with a p-value of .05 or less, the results are considered significant and not due to chance.
Let’s consider the four rightmost columns of the table to establish the equation for the t-test:
- The T-value is used to determine significance.
- df (degrees of freedom) indicates the degrees of freedom in the calculation.
- Two-tailed p Significance: shows the p-value (significance).
Representation of the Equation for the t-Test t(df) = T-value, p = two-tailed significance
t(797) = 34.660, p < .001
Here is the translated version of your text, with attention to SEO and the specified language style:
Calculating Effect Sizes in SPSS

Sure, here’s the information presented in a two-column table format:
| Value of Effect Size Cohen’s d | Interpretation |
|---|---|
| |d| ≤ 0.2 | Small Effect |
| 0.2 < |d| ≤ 0.8 | Medium Effect |
| |d| > 0.8 Large | Huge Effect |
This table format clearly separates the values of Cohen’s d and their corresponding interpretations, making it easy to understand and reference.
Publishing Results
There was a significant difference in the measured weights before and after the diet, t(797) = 34.660, p < .001
Frequently Asked Questions and Answers: Paired t-Test in SPSS
What is a t-test explained simply?
The t-test is a statistical method used to determine whether there is a significant difference between the means of two groups. It is often used to check if the means of treatment and control groups in an experiment differ significantly from each other. There are various types of t-tests, such as the independent t-test and the paired t-test.
What does the t-test do?
The t-test compares the mean of one group with a known value or the mean of another group and then determines whether the difference between these means is significant or not. A significant difference suggests that it’s probably not due to chance and there is indeed a difference between the groups. The t-test also provides a p-value, which indicates the likelihood that a result is due to chance. A small p-value means it’s unlikely the result is due to chance and that a significant difference exists between the groups.
When do you need a t-test?
T-tests are used when you are interested in whether there is a difference between the means of two groups. For example, you might want to investigate the effectiveness of a new drug by administering it to one group of patients and comparing their results with a control group that received a placebo. Another example could be examining whether there’s a difference in the average grades of students using a new textbook versus those using a traditional textbook. There are different types of t-tests depending on whether the data are normally distributed, how many groups there are, the size of the groups, and other factors.
Paired t-Test Example
You want to know if your cereal bars really weigh an average of 100 grams as stated on the packaging. To do this, you weigh 60 bars and compare the actual weight with the weight they should have.


