Why Are There Extreme Values in Data?
Several reasons account for outliers in datasets, with the simplest being the natural variance in human populations. Humans differ in many ways, and a certain degree of variation is normal. Whether something is considered an outlier often depends on the sample being studied. For instance, a person over two meters tall might be labeled as an outlier in a general ‘Height’ sample. However, in a sample specifically comprising basketball teams, this might not be the case.
Research typically focuses on societal averages, aiming to produce results applicable to as many individuals as possible. Therefore, it’s entirely justifiable to exclude outliers in variables crucial for analysis. Conversely, retaining these authentic cases in the dataset can be equally valid. Unfortunately, there’s no one-size-fits-all answer, as it always depends on the specific case. A tip: Increase the number of individuals studied. This approach lessens the impact of outliers and makes their exclusion less influential.
Human error, including incorrect data entry leading to absurd results, is another common source of outliers. This is also true for measurement errors, like those resulting from faulty calibration, creating incorrect data. It’s essential to ensure that not too many data points are generated due to measurement errors, as systematic errors could appear so frequently in the dataset that they become part of the data, rather than being identified as outliers. For these reasons, outliers resulting from data entry errors should be excluded.
Analyzing Outliers with Box-Plot Diagrams
There are several ways to identify outliers in datasets. The scientific community has not reached a consensus on the best or most conclusive method. This lack of agreement stems from the normalcy of datasets not meeting our expectations. Determining when a dataset is no longer normal is always subjective.
The simplest way to find outliers in SPSS is through Box-Plot diagrams. Box-Plot diagrams in SPSS clearly indicate which cases in the datasets could be outliers. This analysis can be conducted for each variable.
What ist an Box-Plot Diagram?
A Box-Plot diagram, also known as a Box-and-Whisker plot, is a graphical tool used to represent the distribution of data. It displays the median, the interquartile range (IQR), and outliers (also referred to as extremes) of a dataset.
The blue “box” of the Box-Plot encloses the lower and upper quartiles in the dataset. This means that 50% of our data lies within this range. In the middle, the median, marked as a line, divides the box into two halves. It symbolizes where 50% of the data is located on each side. The thin antennas are called the upper and lower whiskers and are at most 1.5 times the length of the interquartile range (length of the box). They can vary in size as they align with the actual data points within this boundary. Values outside the whiskers are treated as outliers.
Guide to Finding Outliers in SPSS
Statistical Outliers in SPSS Identified with Box-Plot
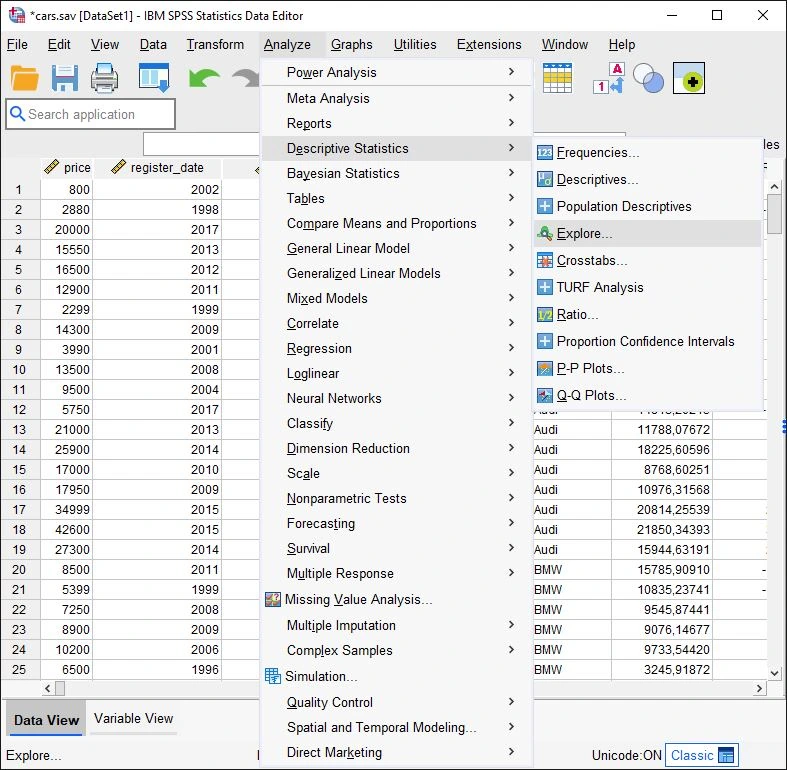
Menu Selection

Step 1 in Finding Outliers in SPSS: Menu Selection Click on Analyze > Descriptive Statistics > Exploratory Data Analysis.
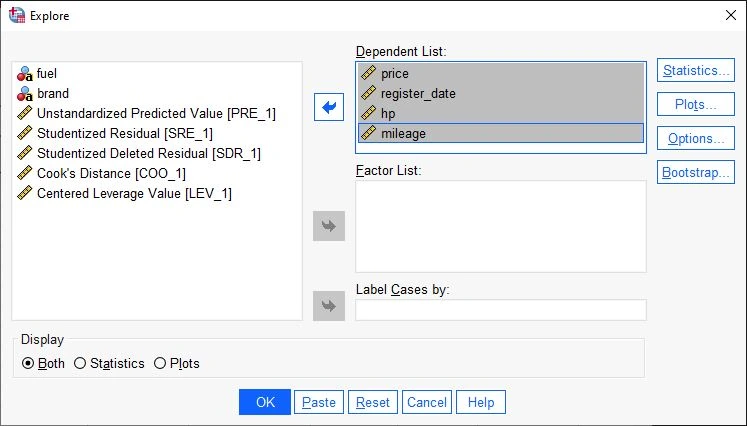
Dialog Box for Exploratory Data Analysis: Settings for Finding Outliers in SPSS

The Exploratory Data Analysis dialog box opens.
In the left column are all available variables. Click on a variable with the left mouse button and hold it down while moving the cursor over the Dependent Variables field. Once there, release the mouse button. This drag-and-drop technique allows us to quickly move variables around in SPSS. We use this method to drag all the variables to be analyzed into the Dependent Variables field.
Each variable dragged into the “Dependent Variables” field generates a chart after the calculation. These charts will display potential outliers.
Note: Alternatively, the blue button with the arrow can be used to move variables into the respective fields.
Additional Note: If there are multiple groups to compare, drag the independent variable (IV) into the Factors List field.Important: In the Display group at the bottom, select the Both option.
Next Step: Click on the Plots button.
Dialog Window: Plots

In the Diagrams dialog box, we focus on the Box-Plots field and ensure that the Factor Levels Together option is selected. Click Continue to confirm the entries.
Ready to Start

Now we are ready and click OK at the bottom to start the exploratory data analysis and see our charts.
Analyzing the Charts: Identifying Outliers in SPSS Example 1
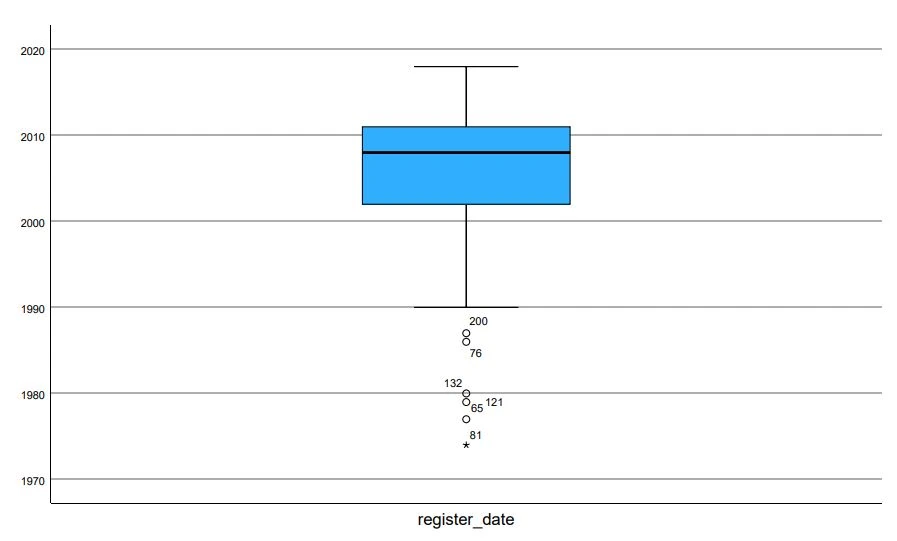
SPSS provides an overview of outliers using Box-Plot diagrams.
Each data point that is disproportionately large or small is listed in this view. If a value is more than 1.5 standard deviations from the mean of the variable, it is considered a mild outlier and marked with a small circle (°). So-called extreme outliers, more than 3 standard deviations from the mean, are visualized with a star (*). The number next to the symbol indicates which case it is.
In our example, we see that for the variable “Horsepower” several mild outliers have been identified. Data points 50, 1, 17, 103, and 31 belong to this category. There is one extreme outlier: Case number 3.
Analyzing the Charts: Identifying Outliers in SPSS Example 2
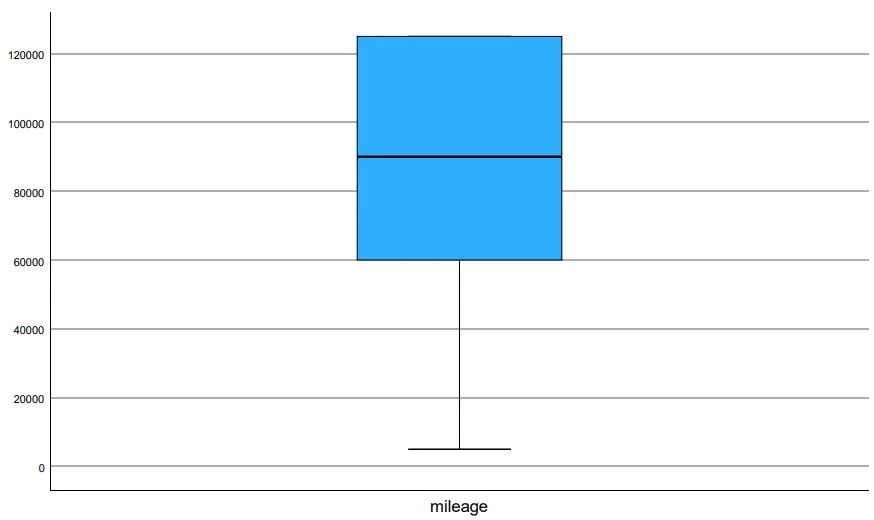
Step 5 in Finding Outliers in SPSS: Box Plot Analysis No Extreme Outliers Example In contrast to the variable “Horsepower,” our method finds no outliers for the variable “Mileage.” The Box-Plot diagram shows us that the data is not evenly distributed, which is not necessarily a problem.
Analyzing the Charts: Identifying Outliers in SPSS Example 3
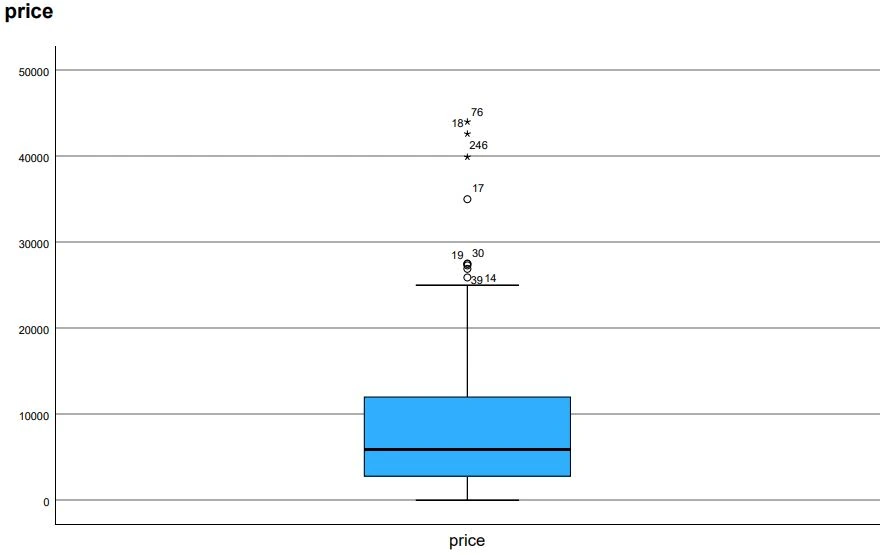
Step 6 in Finding Outliers in SPSS: Box Plot Analysis Multiple Mild and Extreme Outliers Example The final example is the variable “Price.” Here, with this method, we find several outliers on the upper end. Hence, there are particularly expensive used cars on the market that do not meet our expectations based on the data. This is not entirely unrealistic.
Identification of Outliers with Residuals, Leverage Values, and Cook’s Distances
If Box-Plot diagrams are not sufficient for your analysis, you can delve deeper and identify outliers in the dataset using several methods. This guide uses Case Diagnostics, Studentized Deleted Residuals, Leverage Values, and Cook’s Distances.
Analysis with Case Diagnostics
What to Do with Outliers? If we find data points that are widely scattered from the dataset’s mean, there are several ways to proceed:
Generally, extreme outliers should be removed from the dataset, while mild outliers may or may not be removed. Even among researchers, there is debate about how to handle outliers. Although outlier calculations are based on mathematical formulas providing an objective assessment, they are also controversial, especially with smaller datasets. Moreover, removing outliers too hastily can polish the data by eliminating all non-conforming results. Incidentally, the first ozone holes were also initially ignored as statistical outliers.
Publishing Results
If no outliers were found: The dataset contained no outliers.
If outliers were found: Three cases showed extreme values and were excluded from further data analysis.
Frequently Asked Questions and Answers: Finding Outliers in SPSS
How Are Outliers Determined?
Outliers, also referred to as “Outliers,” are extreme values in a dataset that significantly deviate from the other values. They can lead to distortion in the statistics calculated on the data, thus impacting the analysis.
There are several ways to determine outliers in a dataset, depending on the specific context and available data. Here are some examples:
– Box-Plot: A Boxplot is a graphical representation used to visualize data distribution. Outliers can be identified in a Boxplot as values lying outside the “Whiskers,” representing the upper and lower limits of the Boxplot.
– Standard Deviation: The standard deviation measures the spread of data around the mean. Outliers can be identified as values more than two standard deviations away from the mean.
– Z-Score: The Z-Score measures how far a particular value is from the mean of the dataset. Outliers can also be identified as values with a Z-Score of more than 3 or less than -3. The Z-Score indicates how many standard deviations a value is from the mean.
There are other methods like the Grupps Test, which we will not delve into.
Which Outliers to Exclude?
Outliers, also referred to as “extremely high or low values,” are data points that significantly deviate from the other data points in a sample. They can result from measurement errors, human errors, or other unusual events and can influence data analysis.
There are various ways outliers can be handled in statistics:
– Ignoring: In some cases, outliers can be simply ignored if they have little impact on the analysis.
– Removing: In some cases, outliers can be removed to prevent them from influencing the analysis. However, this can result in the loss of important information.
– Correcting: In some cases, outliers can be corrected by identifying and addressing the cause of the outlier.
– Using More Robust Statistics: In some cases, more robust statistics can be used.
When Is a Value Considered an Outlier?
A value is considered an outlier when it significantly deviates from the other values in a sample. However, whether a value is considered an outlier depends on various factors, such as the type of data, the size of the sample, and the analytical methods used.
It’s important to note that the definition of outliers is subjective, and there is no definitive threshold for when a value is considered an outlier. You should always carefully consider whether a value should be treated as an outlier and how outliers should be handled in your analysis.
What Is an Outlier Analysis?
Outlier analysis in statistics is a method for investigating extremely high or low values in a sample, also known as outliers. Analyzing outliers can help identify potential errors or unusual events in the data and understand how they may influence the analysis.
There are various ways to conduct outlier analysis. One way is to use Boxplots to visually identify outliers. Another way is to use statistical tests to determine if a value can be considered an outlier.
When conducting outlier analysis, you should first decide whether you want to remove, ignore, or correct outliers. You should also decide whether to use more robust statistics that are less susceptible to outliers. Once you’ve made these decisions, you can treat the outliers accordingly and continue your analysis. It’s important to understand the impact of outliers on your analysis and take them into account.
Why Are Outliers a Problem?
Outliers, also known as “extremely high or low values,” are data points that significantly deviate from the other data points in a sample. They can result from measurement errors, human errors, or other unusual events and can influence data analysis.
If outliers are not considered, they can lead to unreliable data analysis and false conclusions.

