Understanding Reliability Analysis
Reliability analysis provides insights into the dependability of an analysis. It measures the extent to which a method consistently yields the same results upon repeated applications. If you were to repeat your experiment, would you obtain similar outcomes? A “No” answer implies a problem. Perfect reliability means a measurement (be it an experiment or a questionnaire) always produces identical results, provided the conditions remain constant. Conversely, low reliability leads to varied outcomes under the same conditions.
What is Cronbach’s Alpha in Reliability Analysis?
Cronbach’s Alpha is a widely recognized reliability coefficient used to evaluate the internal consistency or reliability of a set of measurements. It is most commonly applied to assess the reliability of scales or questionnaires comprised of multiple items. Cronbach’s Alpha is derived from the correlation coefficient among the scale’s items, yielding a value between 0 and 1. A higher value denotes greater reliability.
Nonetheless, Cronbach’s Alpha has certain limitations, particularly in assessing scales with few items or when the items exhibit weak intercorrelations. Despite these limitations, Cronbach’s Alpha is a vital tool for gauging internal consistency in measurements and proves beneficial in various disciplines. This introduction focuses on the application of Cronbach’s Alpha.
Where can I find the sample data for this tutorial?
The sample data is available here: Sample data
Calculating Reliability with SPSS and Cronbach’s Alpha
Reliability with SPSS:
Selection of Reliability Analysis in the Menu

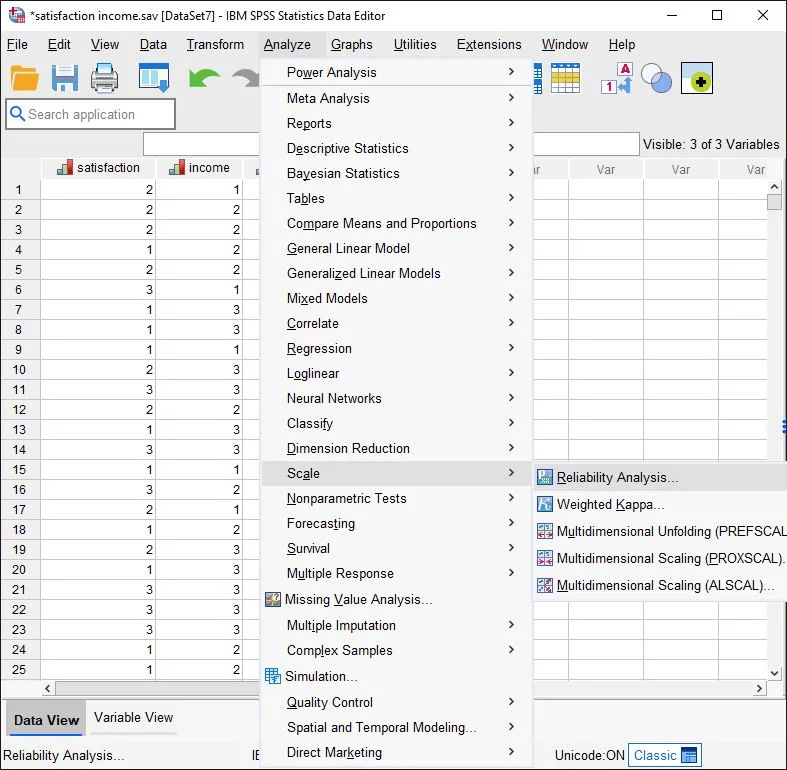
Click on Analyze > Scale > Reliability Analysis.
Note: In older versions, the labels may differ. For example, it might be: Analyze > Scale > Reliability Analysis.
Reliability Analysis Dialog Box

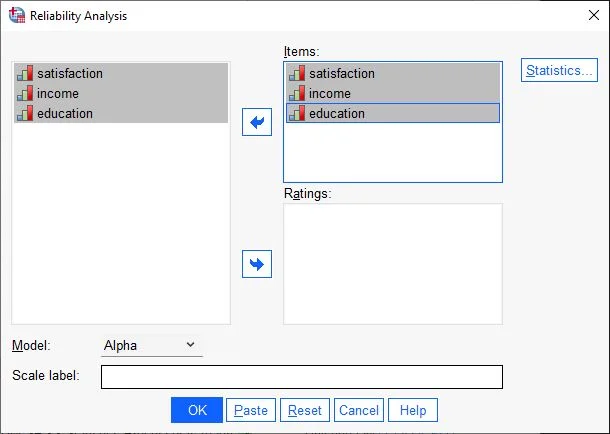
In the dialog box, we see two columns. On the left are the variables available in the dataset. We drag the variables we want to use for the calculation into the right field, Items.
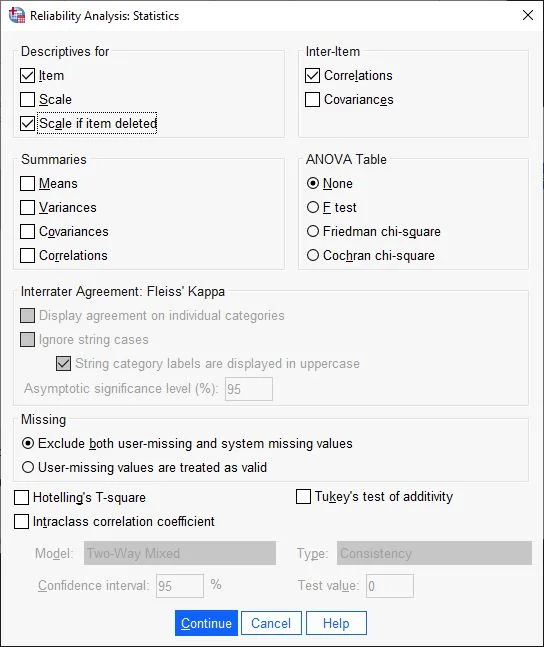
Then, on the right side of the window, click the Statistics button.Setting Statistics

Click in the Descriptive Statistics for field on the options
– Item
– Scale if Item deleted.In the Inter-Item field, choose Correlations.
Confirm the entries by clicking on the Continue button.
Ready to Start

Finally, confirm the entries by clicking on the Continue button.
Interpreting the Output
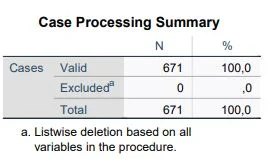
SPSS now provides us with several tables for analysis. Let’s start with the valid cases in the Case Processing Summary table. In our example, no case was excluded, and all cases are valid, N=671.
Cronbach’s Alpha Reliability Statistics
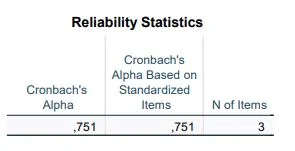
Let’s move to the most important table: the output of Cronbach’s Alpha. In the first column “Cronbach’s Alpha,” we see the value .751, in the second column we recognize the Cronbach’s Alpha calculated from correlations, and in the third column, the number of items is listed (this refers to the number of variables examined).
What do we do with the result? Generally, the higher the Cronbach’s Alpha value, the better. We refer to the following table to understand the quality of the Cronbach’s Alpha value:
| Chronbach´s Alpha | Evaluation | Recommendation |
|---|---|---|
| > 0.9 | excellent | ✔ |
| > 0.8 | Good or high | ✔ |
| > 0.7 | acceptable | ⚠ |
| > 0.6 | questionable | ⛔ |
| > 0.5 | bad | ⛔ |
| ≤ 0.5 | unacceptable | ⛔ |
This table provides an overview for interpreting Cronbach’s Alpha. In our sample dataset, it stands at .0751 and is rated as “acceptable” according to the table. The larger the value, the better. Anything below .5 is inadequate, and values under .8 can at least be critically discussed.
How to increase Conbach´s Alpha Value?
There are several ways to increase the Cronbach’s Alpha value. Reliability analyses with many variables tend to yield higher Cronbach’s Alpha values. Additionally, it may be useful to exclude particularly “weak items” from the calculation to increase the value. How to do this is described later in this guide.
Caution: The goal of statistics is not to produce artificially desirable numbers. Presenting data in a way that somehow achieves an acceptable result should not be your motivation. We aim to uncover the truth in your dataset, not to embellish it.
What does negative Cronbach´s Alpha Values mean?
Sometimes the analysis yields a negative Cronbach’s Alpha value, which is not good. If this happens, we should take a closer look at the Inter-Item Correlation matrix. Perhaps we forgot to invert items. This means that negated questions in the dataset were not changed or items in the dataset are contradicting each other.
Item Statistics
Next step. We look at the overview table named “Item Statistics”. We see columns for Mean, Standard Deviation (Std. DeviationStandardabweichung Die Standardabweichung ist ein Maß für die Streuung der Werte einer Variablen um ihren Mittelwert und gibt an, wie sehr die Werte von ihrem Durchschnitt abweichen. Sie wird häufig verwendet, um die Varianz innerhalb einer Population oder Stichprobe zu beschreiben und kann verwendet werden, um die Normverteilung einer Variablen zu beschreiben. Eine kleine Standardabweichung bedeutet, dass die Werte der Variablen dicht um ihren Mittelwert clustern, während eine große Standardabweichung darauf hinweist, dass die Werte der Variablen weiter verteilt sind. ; SD), and Number of Cases (Units of Investigation, Cases, N).
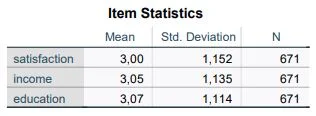
At a glance at this table, we recognize the average response behavior for each question. We keep our used scale in mind. In our sample dataset, the ratings range from 1 to 5. 1 is low, 5 is high. Life satisfaction (m=3.00, sd=1.15) has the lowest average value, while the Income variable (m=3.05, sd=1.14) is only slightly exceeded by the Education variable (m=3.07, sd = 1.14).
Inter-Item Correlation Matrix
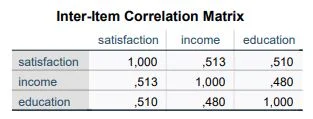
This table shows us the correlations between individual items. We ensure that no items have too high a correlation. If two or more items have too high a correlation, it is an indicator of multicollinearity. This means both items are too similar and essentially carry almost the same information. No value should have a correlation r=.7 or higher! If this is the case, the respective item should possibly be excluded. In our example, the correlation between “Life Satisfaction” and “Income” stands out with a correlation of r=.51. The correlation is high but still within the range. The same applies to other correlations.
Item-Scale Statistics

This table gives us several columns. First, we look at the Corrected Item-Total Correlation. This column is also known as discrimination and tells us how highly the individual items correlate with the others. We ensure that no value is below .3. In our example, this condition is easily met by all items. Typically, all items with too low a correlation should be discarded. This way, we may increase the Cronbach’s Alpha value. The last column is very interesting for us. It indicates what the Cronbach’s Alpha value would be if we do not include this item in the calculation. Our motivation should be to keep reliability as high as possible, but not at any cost. Fundamental items should not be excluded from the calculation lightly.
In our example, excluding a variable does not bring any advantage.
Note: If excluding a variable changes the value only insignificantly, the item should rather stay and not be removed.
What Should I Do If I Want to Exclude a Variable?
It’s quite straightforward. You simply restart the calculation and omit the particular variable in the settings. This means you do not drag the variable into the Items field.
We stay on the table and look at the column for squared multiple correlation, which informs us about the explanatory variance (R²), familiar from regression analysis. SPSS does much of the work for us, calculating an individual multiple regression for each item, where the other variables serve as predictors, and it also inherits the weaknesses of regression analysis: the more items, the higher the R² tends to be.
Publishing Results
When calculating internal consistency, a positive Cronbach’s Alpha value of .751 was determined. This is an indicator of acceptable internal consistency.
Conclusion on Reliability Analysis in SPSS
Reliability test procedure
Overall, reliability is a crucial concept in statistics, describing the stability or consistency of measurements. Reliability analysis can be used to assess the reliability of measurement instruments or methods and is especially important when making comparisons between groups or over time.
There are various reliability coefficients suitable for different types of measurements and available data. It’s important to consider the strengths and weaknesses of these coefficients when assessing reliability. By examining reliability carefully and critically, you can ensure that the measurements are reliable and valid, making them suitable for analysis and interpretation of the data.
5 Facts About Reliability Analysis in SPSS
- Reliability Refers to the Stability or Consistency of Measurements: It’s about how stable or reliable measurement values are.
- A Measuring Instrument or Method is Reliable if it Produces Consistent Results Over Multiple Applications: If the same results are delivered each time it is used, the instrument or method is considered reliable.
- Reliability is Crucial for Making Comparisons Between Groups or Over Time: It is vital when you want to draw comparisons across different groups or monitor changes over a period.
- There are Various Reliability Coefficients Suitable for Different Types of Measurements and Available Data: Depending on the nature of the measurement and the data at hand, different reliability coefficients can be applied.
- The Strengths and Weaknesses of Various Reliability Coefficients Should be Carefully Considered When Assessing the Reliability of Measurements: It’s important to critically evaluate the reliability coefficients to ensure accurate and reliable measurement assessments.
Reliability Testing Methods
| Type of Reliability | Testing Method |
|---|---|
| Interrate reliability | Cohens Kappa |
| Internal consistency | Cohens Alpha |
| Comparison of test methods | Cohens Kappa |
| Test-retest reliability | ◊ Parallel forms reliability ◊ Split-half reliability or Test Halving Method ◊ Internal Consistency |
Häufig gestellte Fragen und Antworten: Reliabilitätsanalyse in SPSS
What is reliability analysis?
Reliability analysis is a statistical technique used to evaluate the reliability or stability of measurements or tests. A measurement or test is reliable if it produces the same results when performed multiple times.
Test-retest reliability: this type of reliability is used to evaluate the stability of measurements or tests over time. For example, one might examine the test-retest reliability of a personality test by administering the test to the same individuals at two different times and then comparing how similar the results are.
Inter-rater Reliability: this type of reliability is used to evaluate the agreement between two or more raters taking the same measurements or tests. For example, one might examine the inter-rater reliability of school performance assessments by assigning two or more teachers to assess the same students and then comparing how similar their assessments are.
Parallel Form Reliability: This type of reliability is used to assess the stability of measurements or tests over time. It is used when there are two or more similar versions of a test or measurement called parallel forms. Parallel forms reliability is particularly useful when using tests or measurements that are administered over a long period of time, for example, in education or psychological diagnosis.
What does Cronbach Alpha say?
Cronbach Alpha is a measure of the internal consistency or reliability of measurements or tests. It is used to evaluate how well the questions or items included in a test work together to measure a particular construct or concept.
Cronbach Alpha is calculated on a scale of 0 to 1, with a higher value representing higher internal consistency or reliability. A Cronbach Alpha value of 0.7 or higher is generally considered acceptable, while a value of 0.8 or higher is considered very good.
Cronbach Alpha is particularly useful when using tests or measurements that consist of multiple questions or items, for example in education or psychological diagnosis.
When to use Cronbach’s alpha?
Cronbach Alpha can be used to assess whether a test or measurement is reliable enough to serve as a basis for important decisions, for example in personnel psychology selection or in the diagnosis of mental disorders.
It is important to note, however, that Cronbach’s alpha is only a measure of internal consistency and does not indicate whether the test or measurement is valid, that is, whether it actually measures what it claims to measure. Validity is a separate property that must be examined in other ways.
What to do if Cronbach’s alpha is bad?
If the Cronbach’s Alpha values of a test or measurement are below the acceptable level of 0.7, some steps could be taken to improve internal consistency or reliability:
Review questions or items: it might be helpful to review the questions or items in the test or measurement to ensure that they all contribute to a consistent concept or construct. It might also be useful to review the questions or items to make sure they are understandable and free of errors.
Removing questions or items: it might be useful to remove questions or items from the test or measurement that do not fit well with the other questions or items or that reduce internal consistency.
Improving instructions and administration: it might be useful to revise the instructions for the test or measurement to ensure that they are clear and understandable, and to improve the administration of the test or measurement to ensure that it is conducted consistently.
It is important to note, however, that improving the internal consistency or reliability of the test or measurement does not automatically mean that it is valid, i.e., that it actually measures what it claims to measure. Validity is a separate property that must be examined in a different way.
What are further links to Check Reliability in SPSS
An article from Gesis.org: here
Wikipedia article about reliability: here
A definition from Spektrum: here
Methods portal of the University of Leipzig: here
What influences reliability?
The reliability of measurements or tests can be influenced by various factors. Here are some examples:
Quality of questions or items: de quality of questions or items included in a test or measurement can affect reliability. Questions or items that are unclear, flawed, or do not contribute to a consistent concept or construct can reduce reliability.
Instructions and administration: the quality of the instructions and administration of the test or measurement can affect reliability. If instructions are unclear or if the test or measurement is not administered consistently, this can reduce reliability.
Test conditions: Test conditions can affect reliability. For example, distractions or confounding factors during testing could reduce reliability.
Population: the composition of the population for which the test or measurement was developed can affect reliability. If the test or measurement has not been validated for the population for which it is being used, this may reduce reliability.
It is important to note that reliability is only a property of measurements or tests and does not indicate whether they are valid, i.e., whether they actually measure what they claim to measure. Validity is a separate property that must be studied in a different way.

